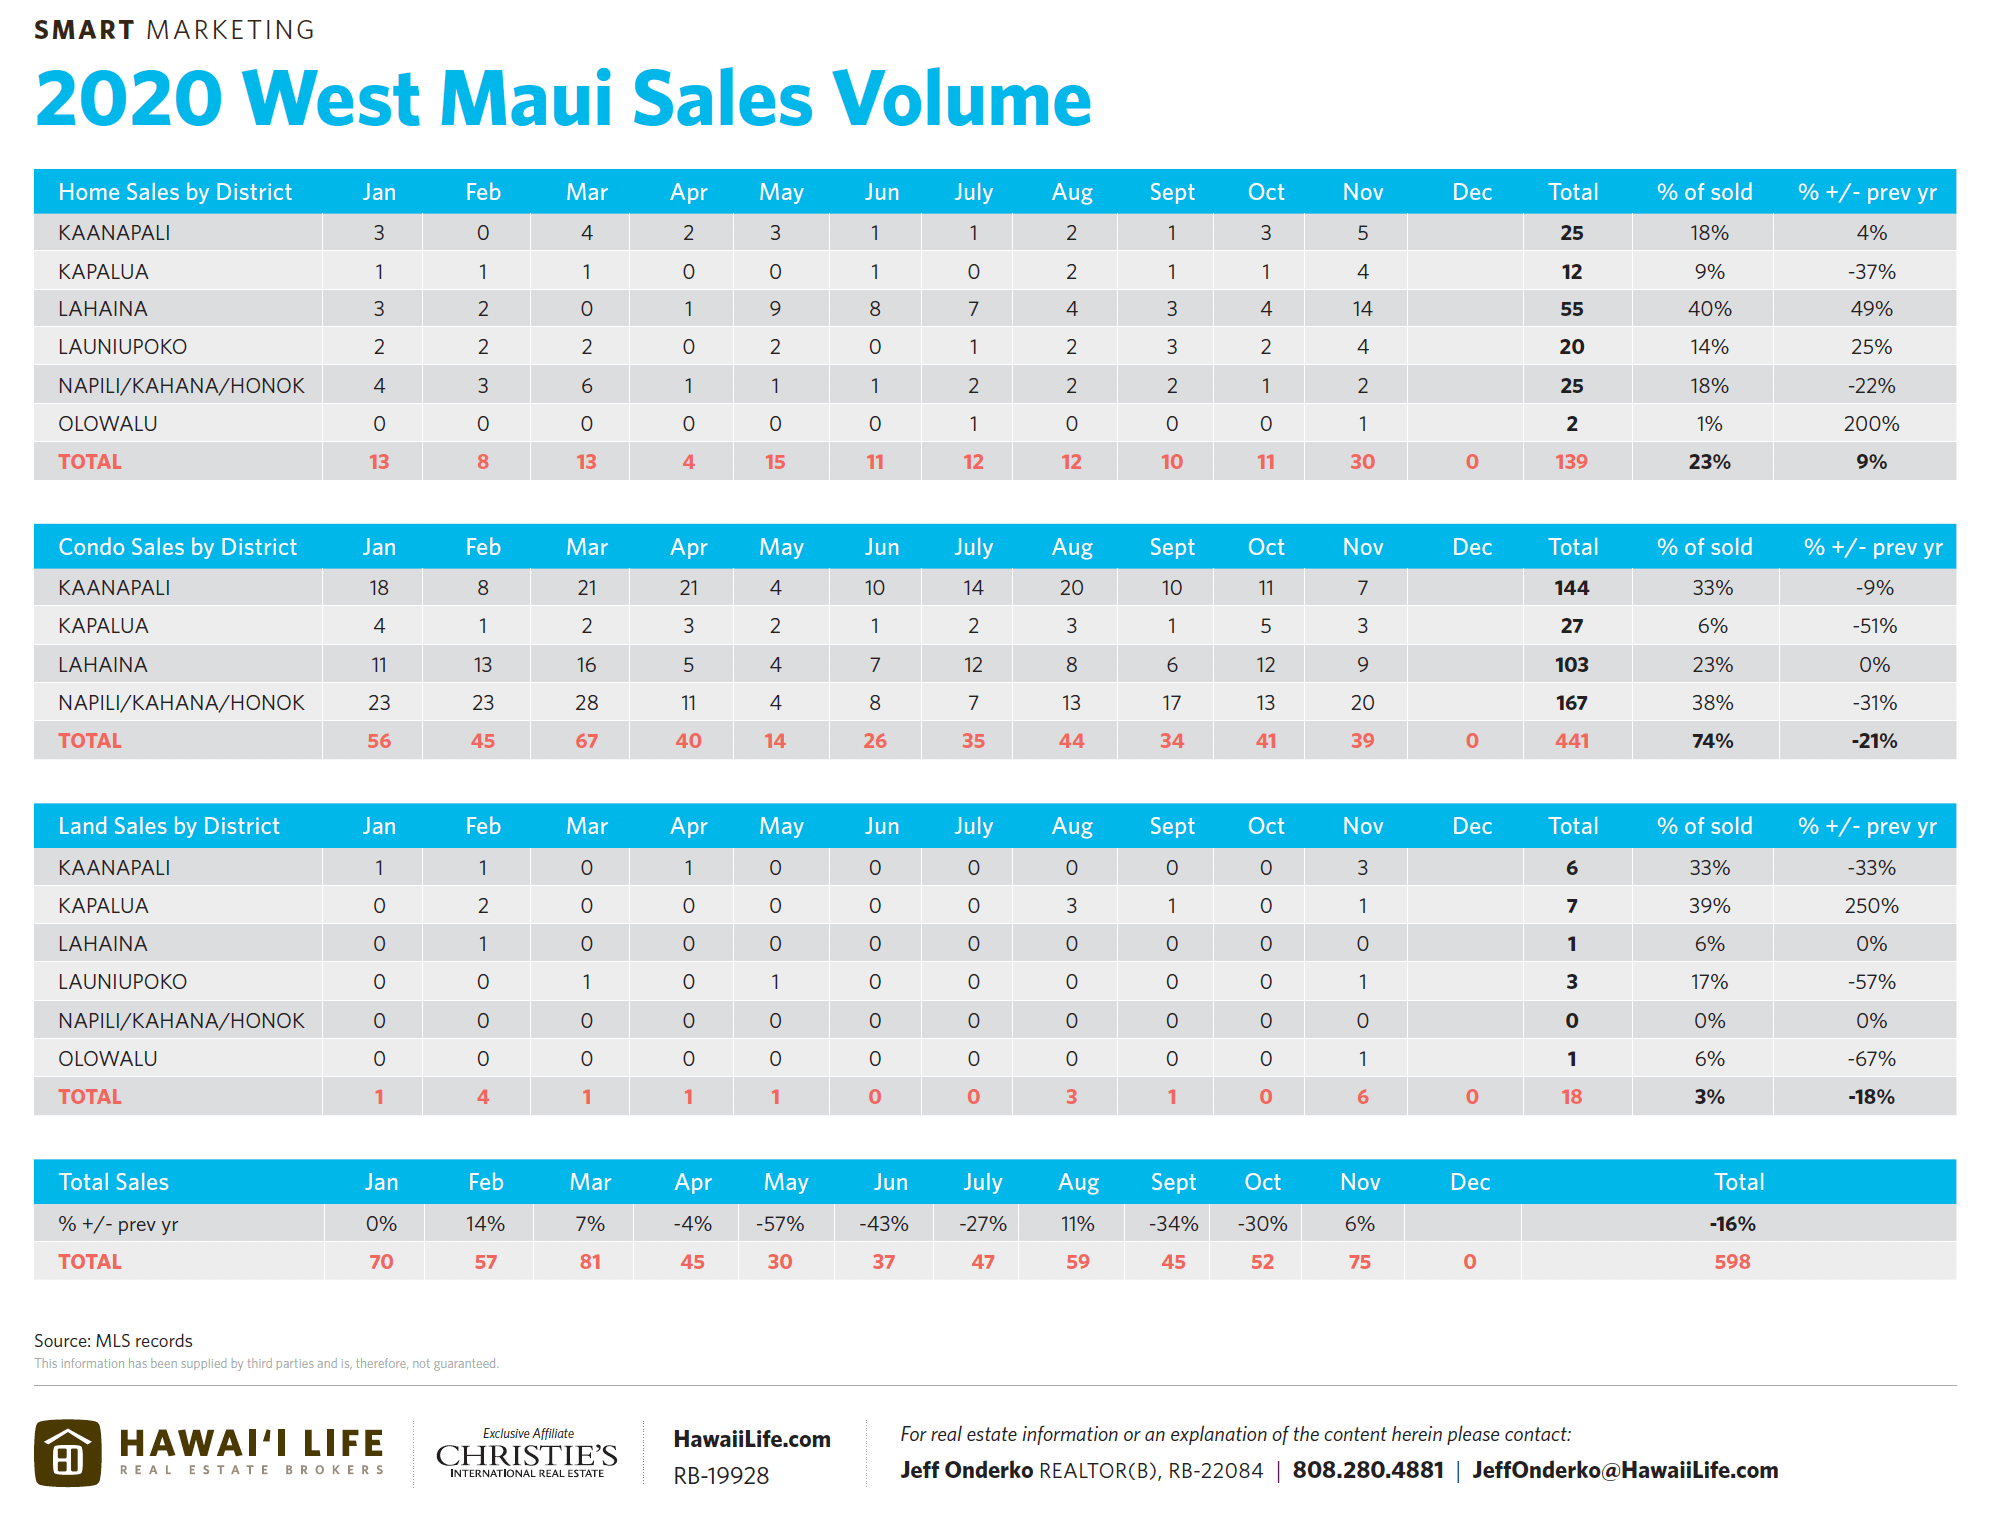
As we head into month 12 of 2020, West Maui Residential Home sale volume is up 9% over 2019, which could be considered a shockingly fantastical statistic after what the state of Hawaii and our island has experienced this year. A not so shockingly fantastical statistic is that West Maui condominium sales are down -21% in 2020.

The latter statistic is brought to attention as it has way more significance on the future market picture. Condos historically have made up 75%-79% of West Maui’s entire annual sales inventory. With condos and little to zero rental income, what in the past has been hard to show and easy to sell has become easy to show and hard to sell.
With that being said, I am pleased to share with you the most recent West Maui home, land, and condo sales reports for your review — covering Kaanapali, Kapalua, Lahaina, and Launiupoko. You’ll find real estate sales volume, days on market, list versus sold price, price per square foot, and significantly more.
West Maui November 2020 Headlines
For further details on any of the statements below, please refer to the sales reports.
- Another Impressive Sales Month | 75 Homes, Land & Condos Close
- Highest Sales Volume Total Since March
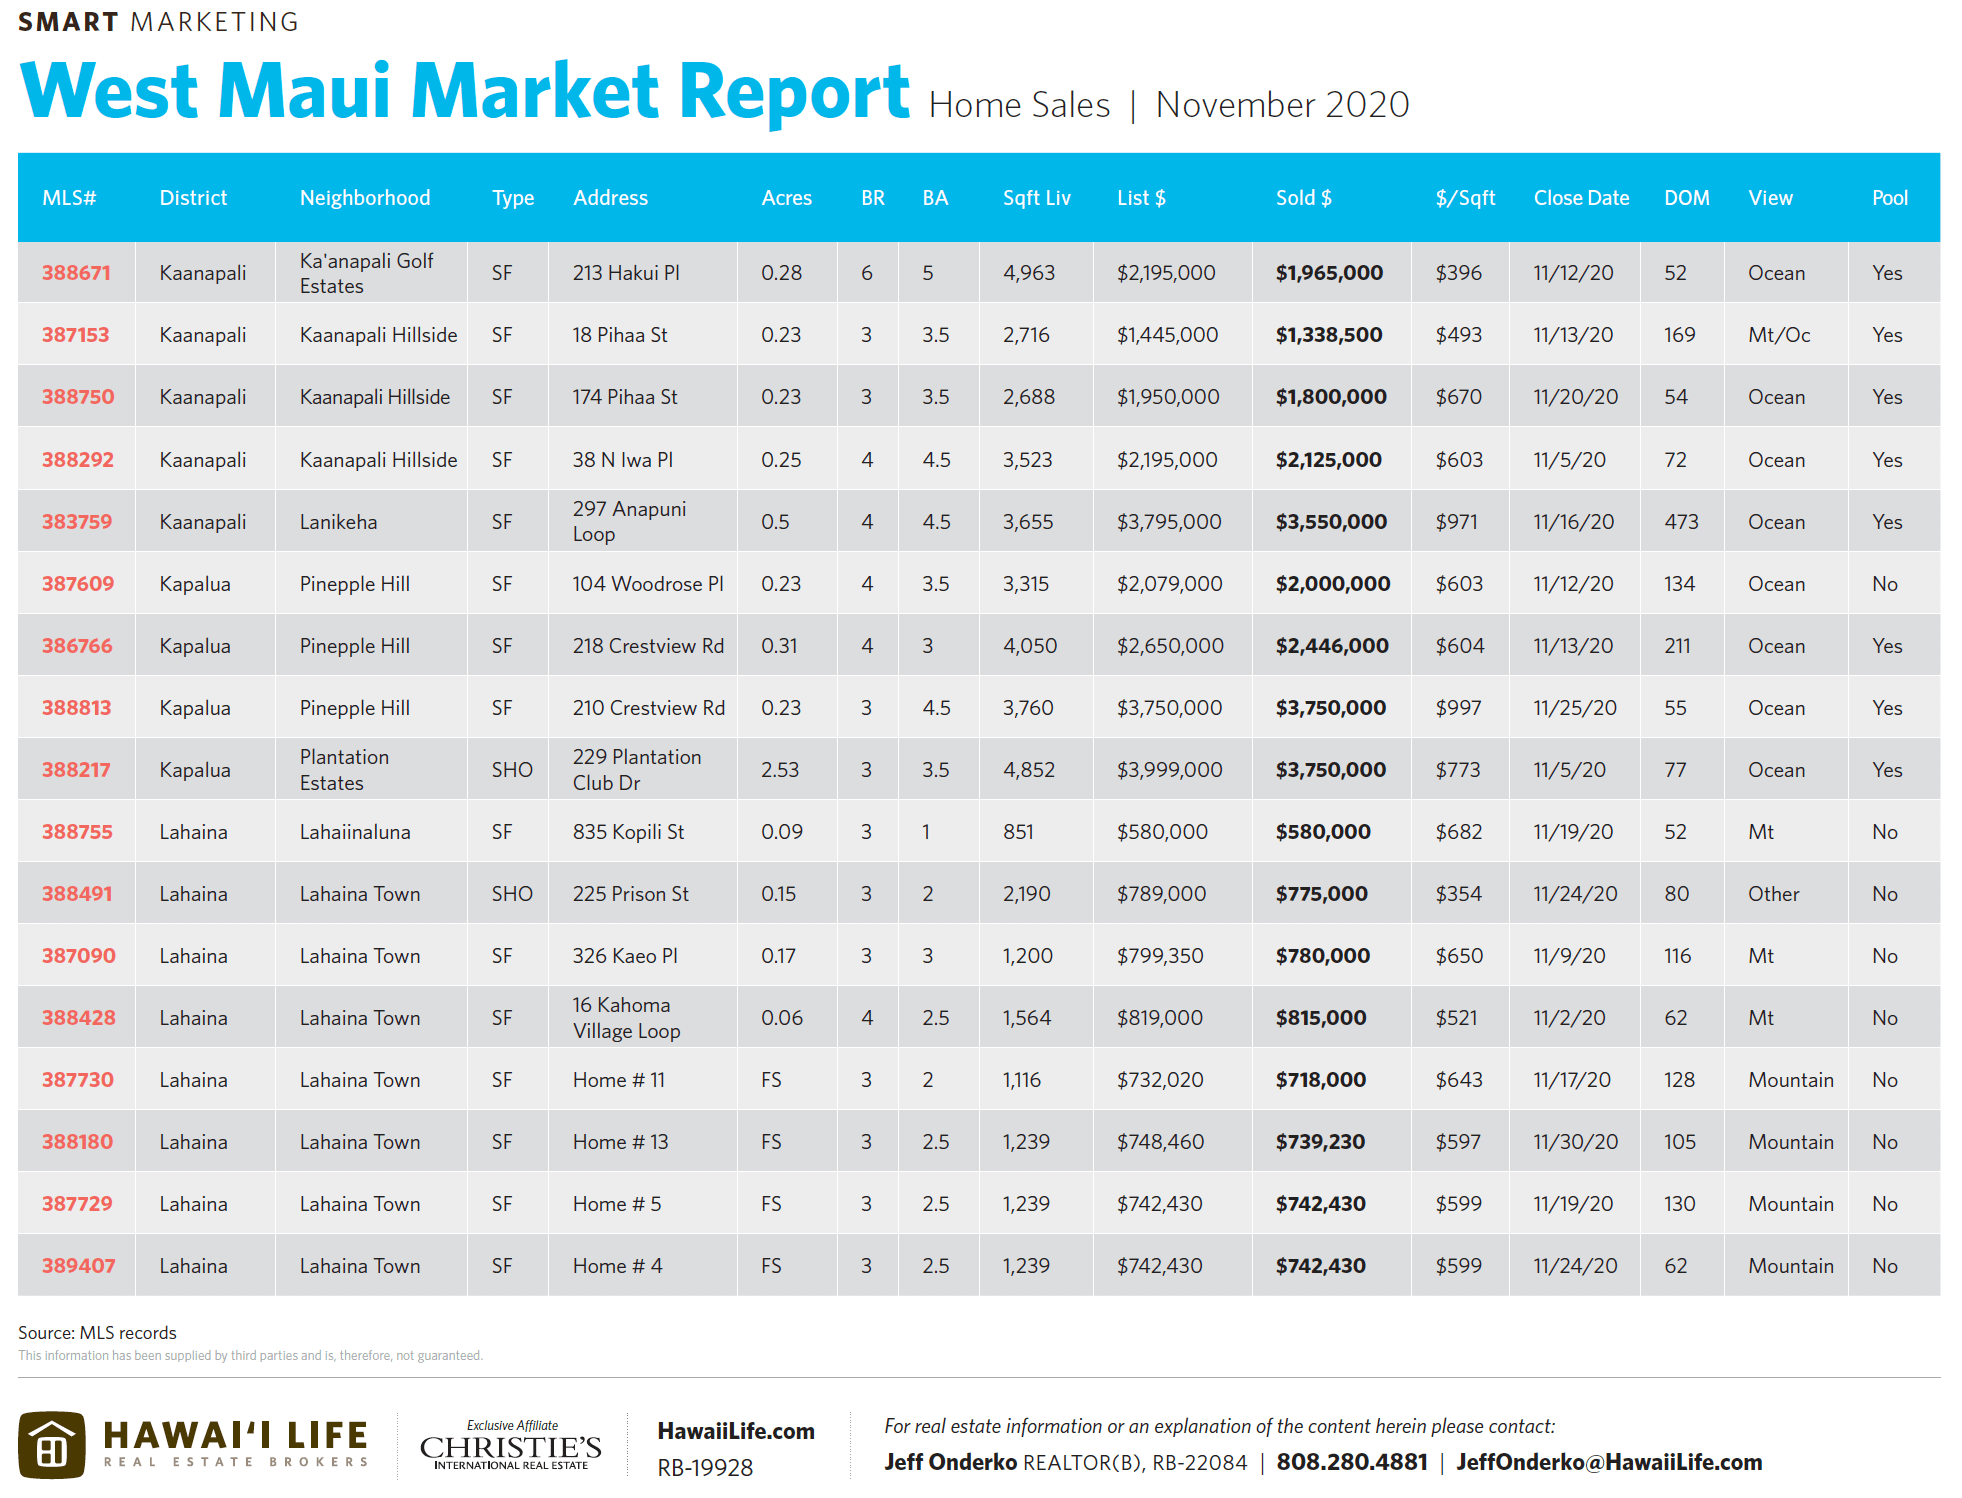
- 30 Home Sales | Best in Many Many Years
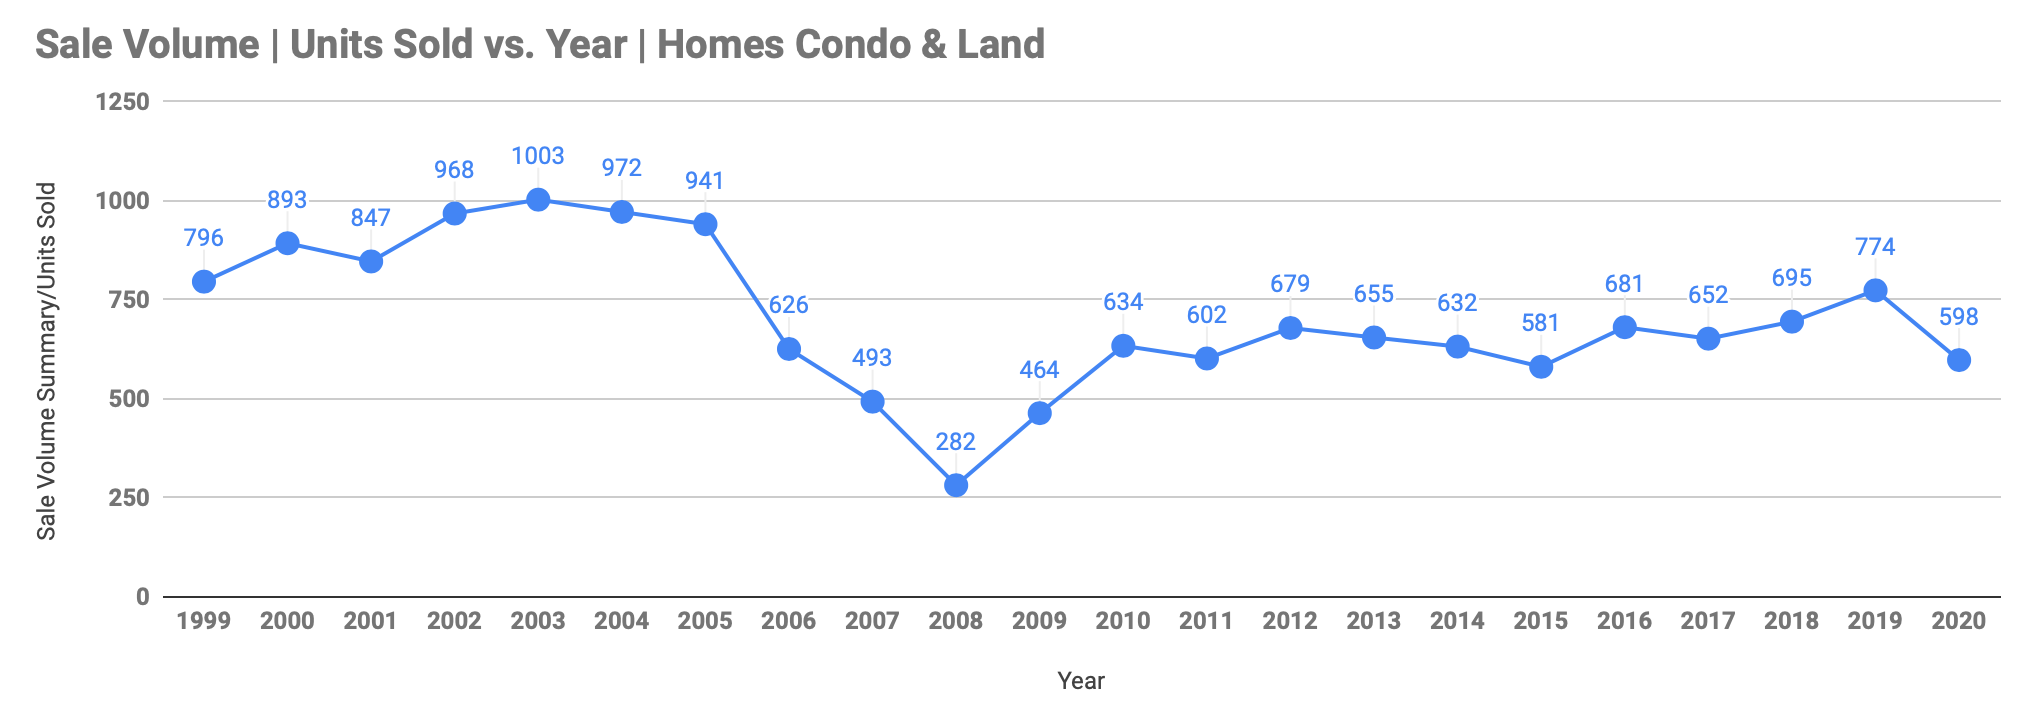
- Market Gaining End of Year Momentum | Volume Off By Only 16%
Highest Priced Sales
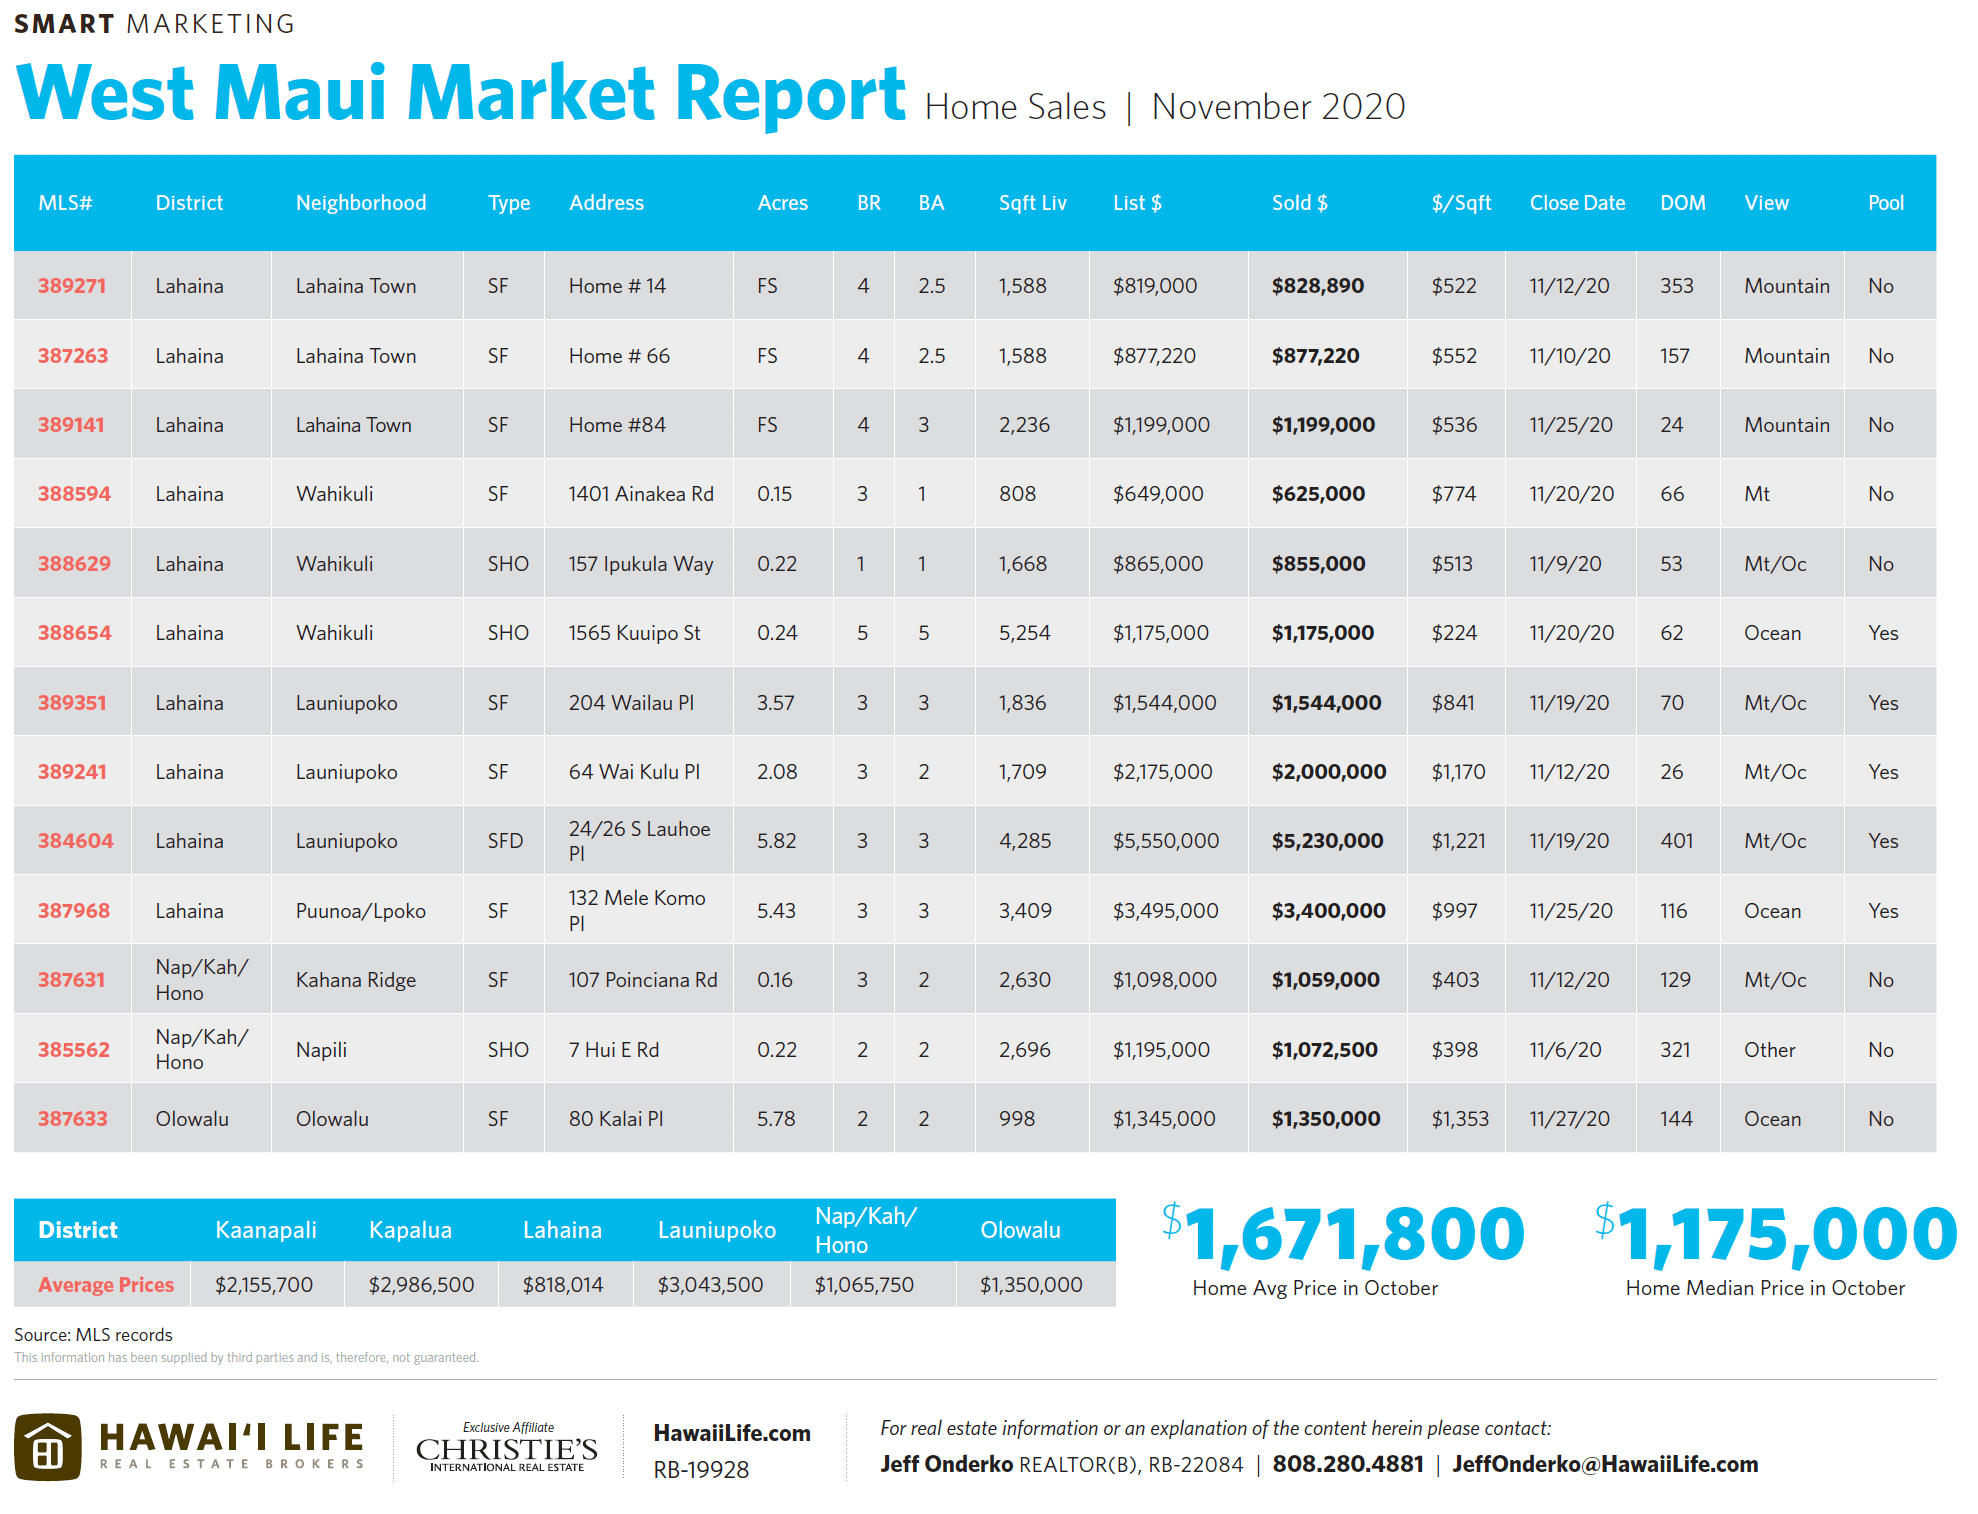
- Home – $5.23M | Launiupoko
- Condo – $3.68M | Lahaina Town
- Land – $1.7M | Launiupoko
Lowest Priced Sales
- Home – $580K | Lahainaluna
- Condo – $150K | West Maui Trades in Nap/Kah/Honokowai areas
- Land – $475K | Kaanapali & Olowalu
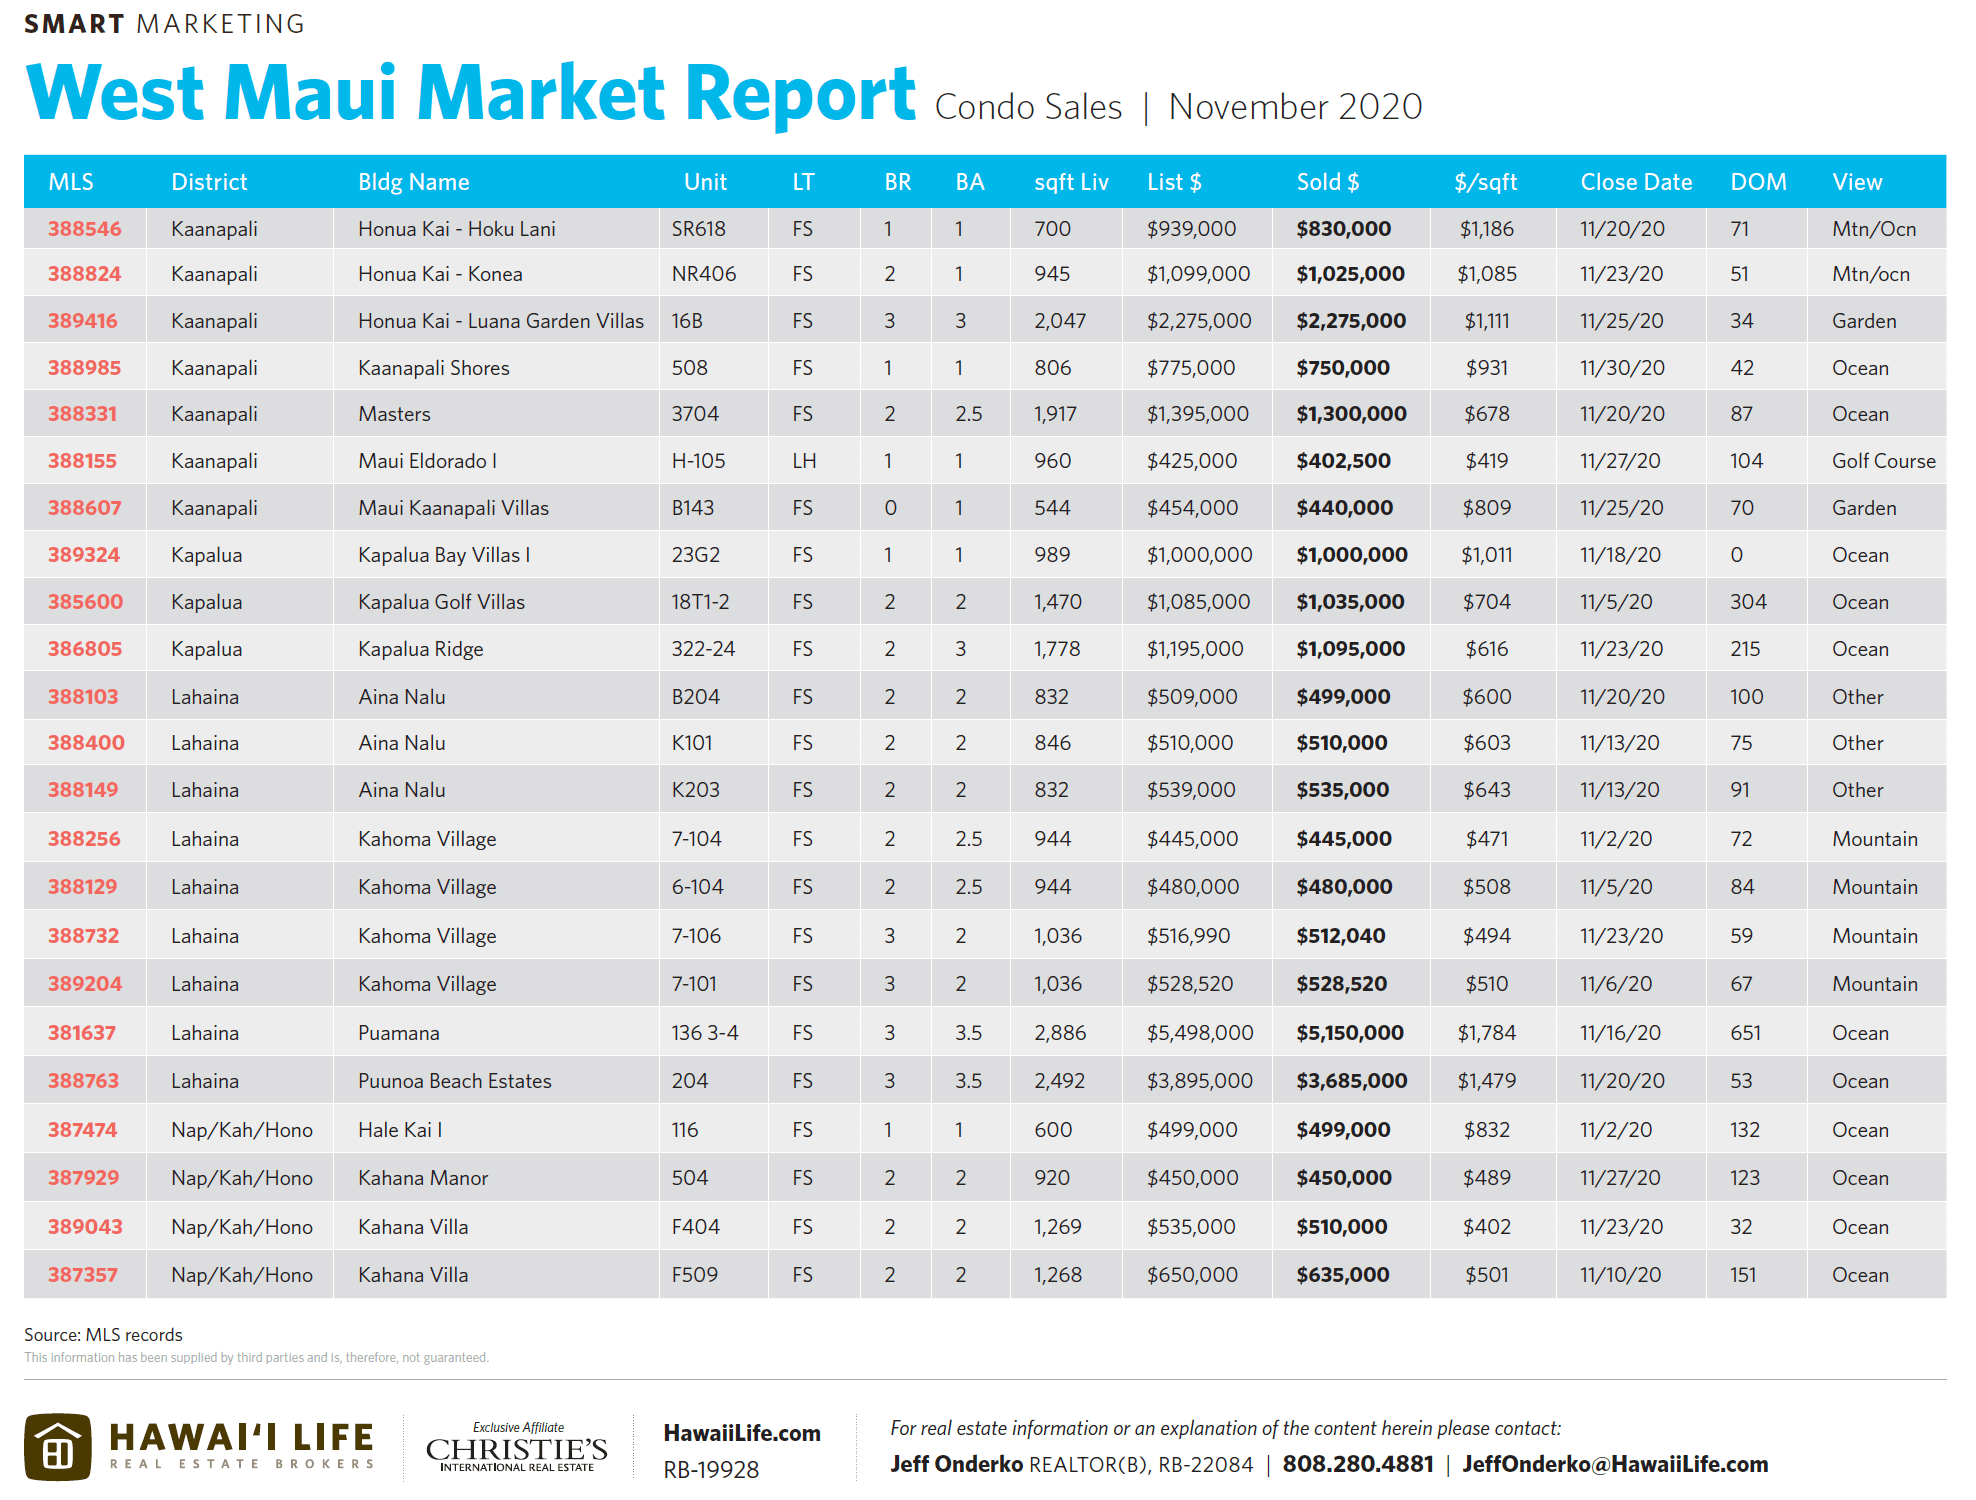
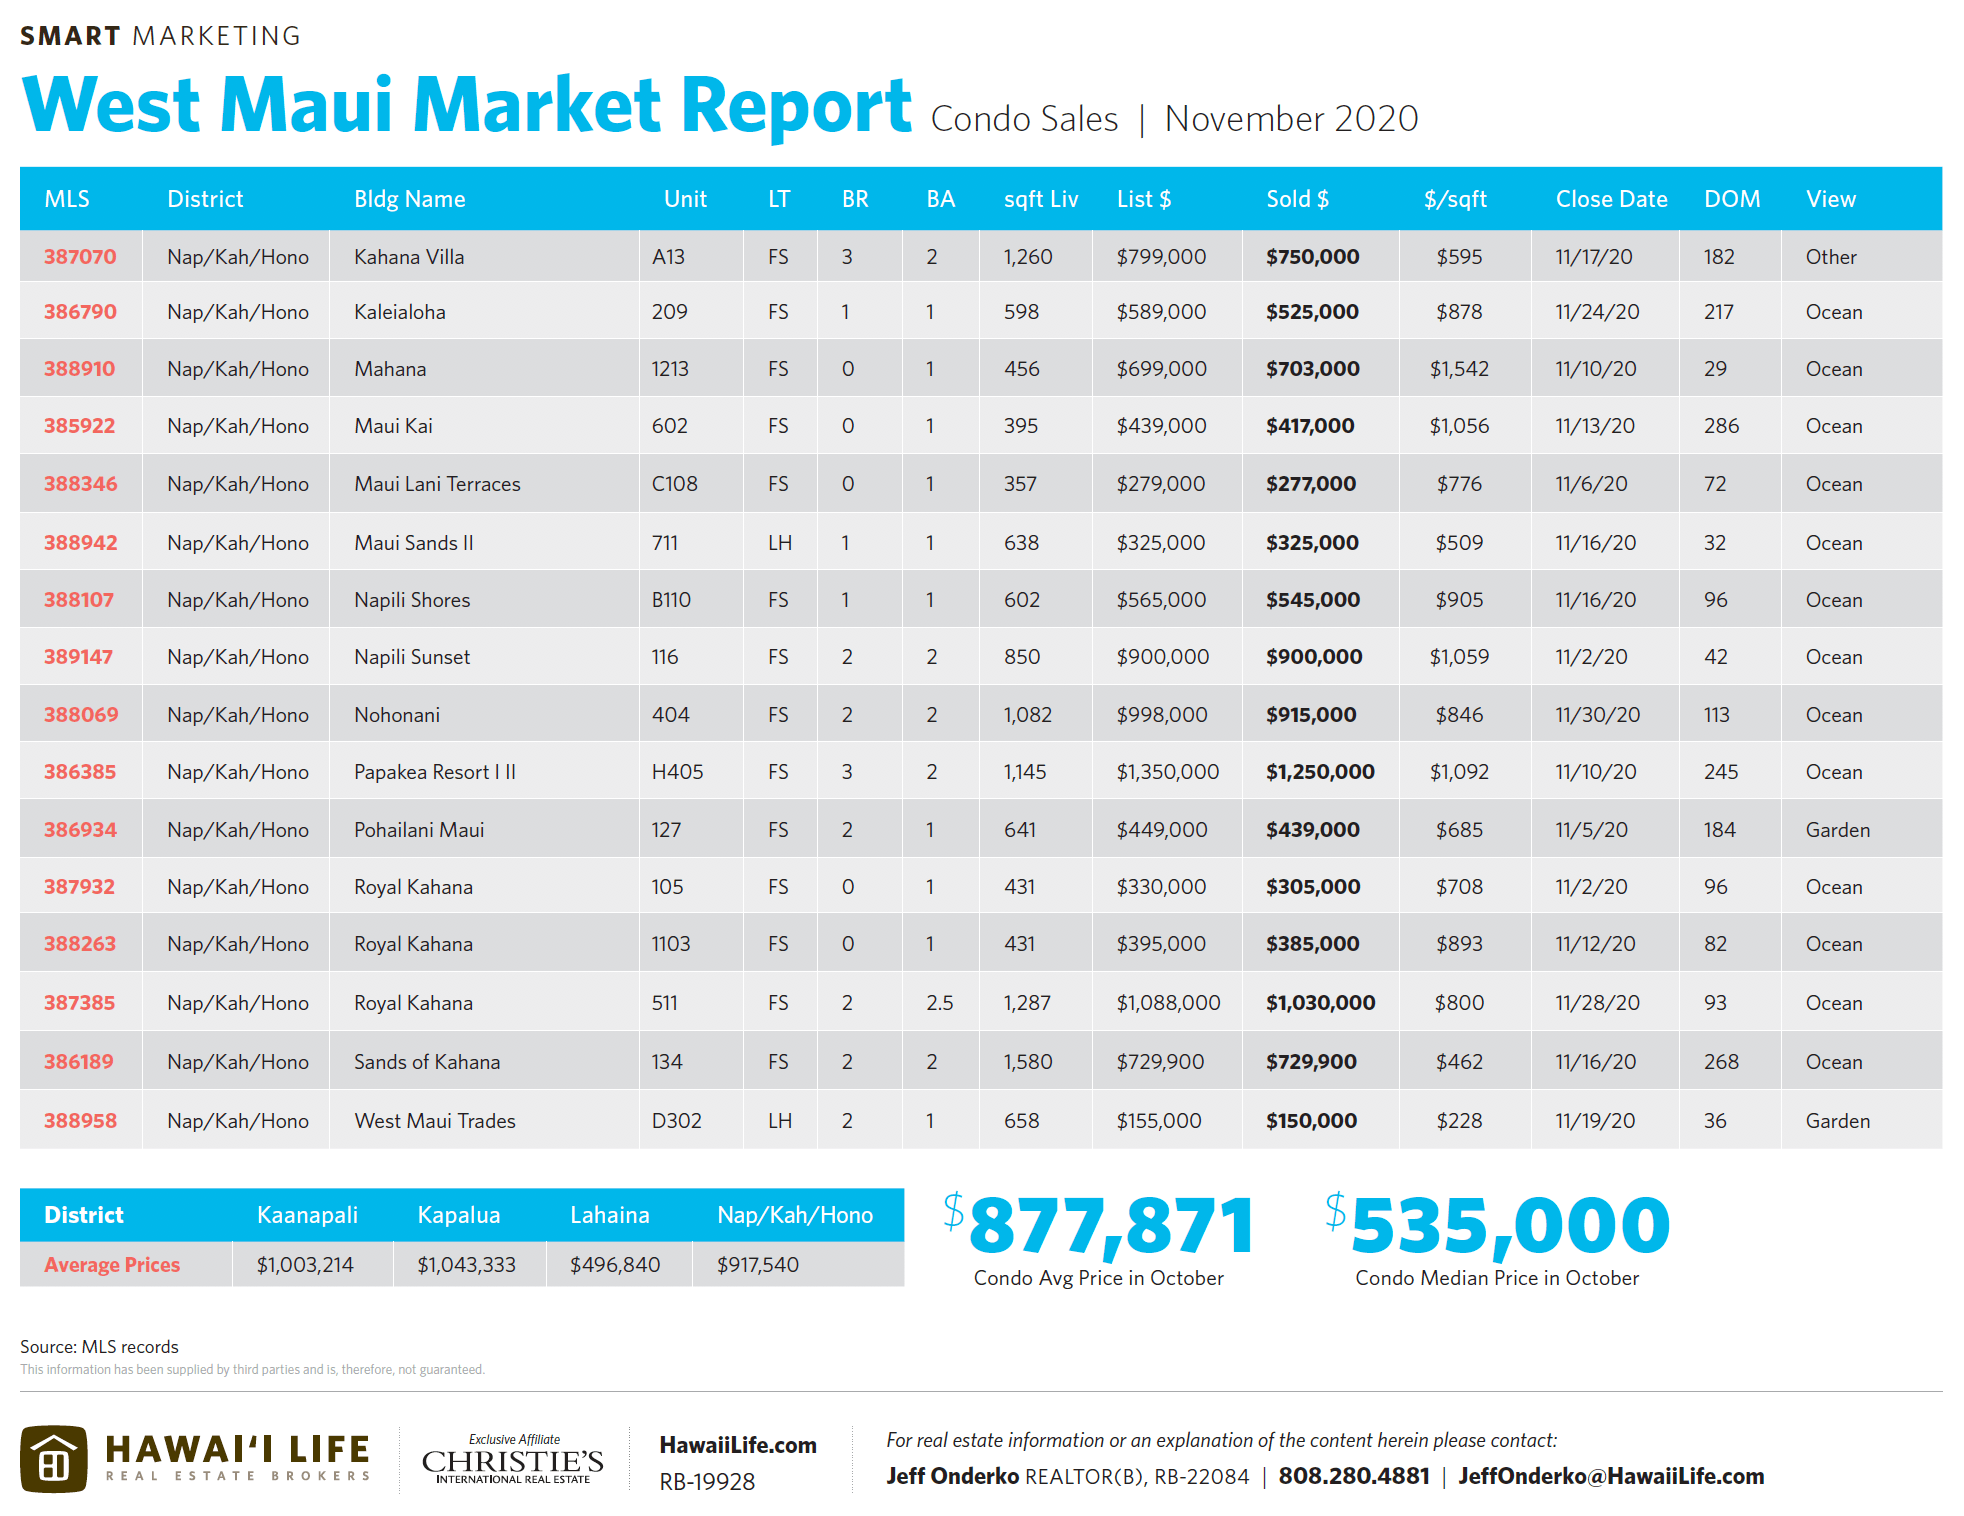
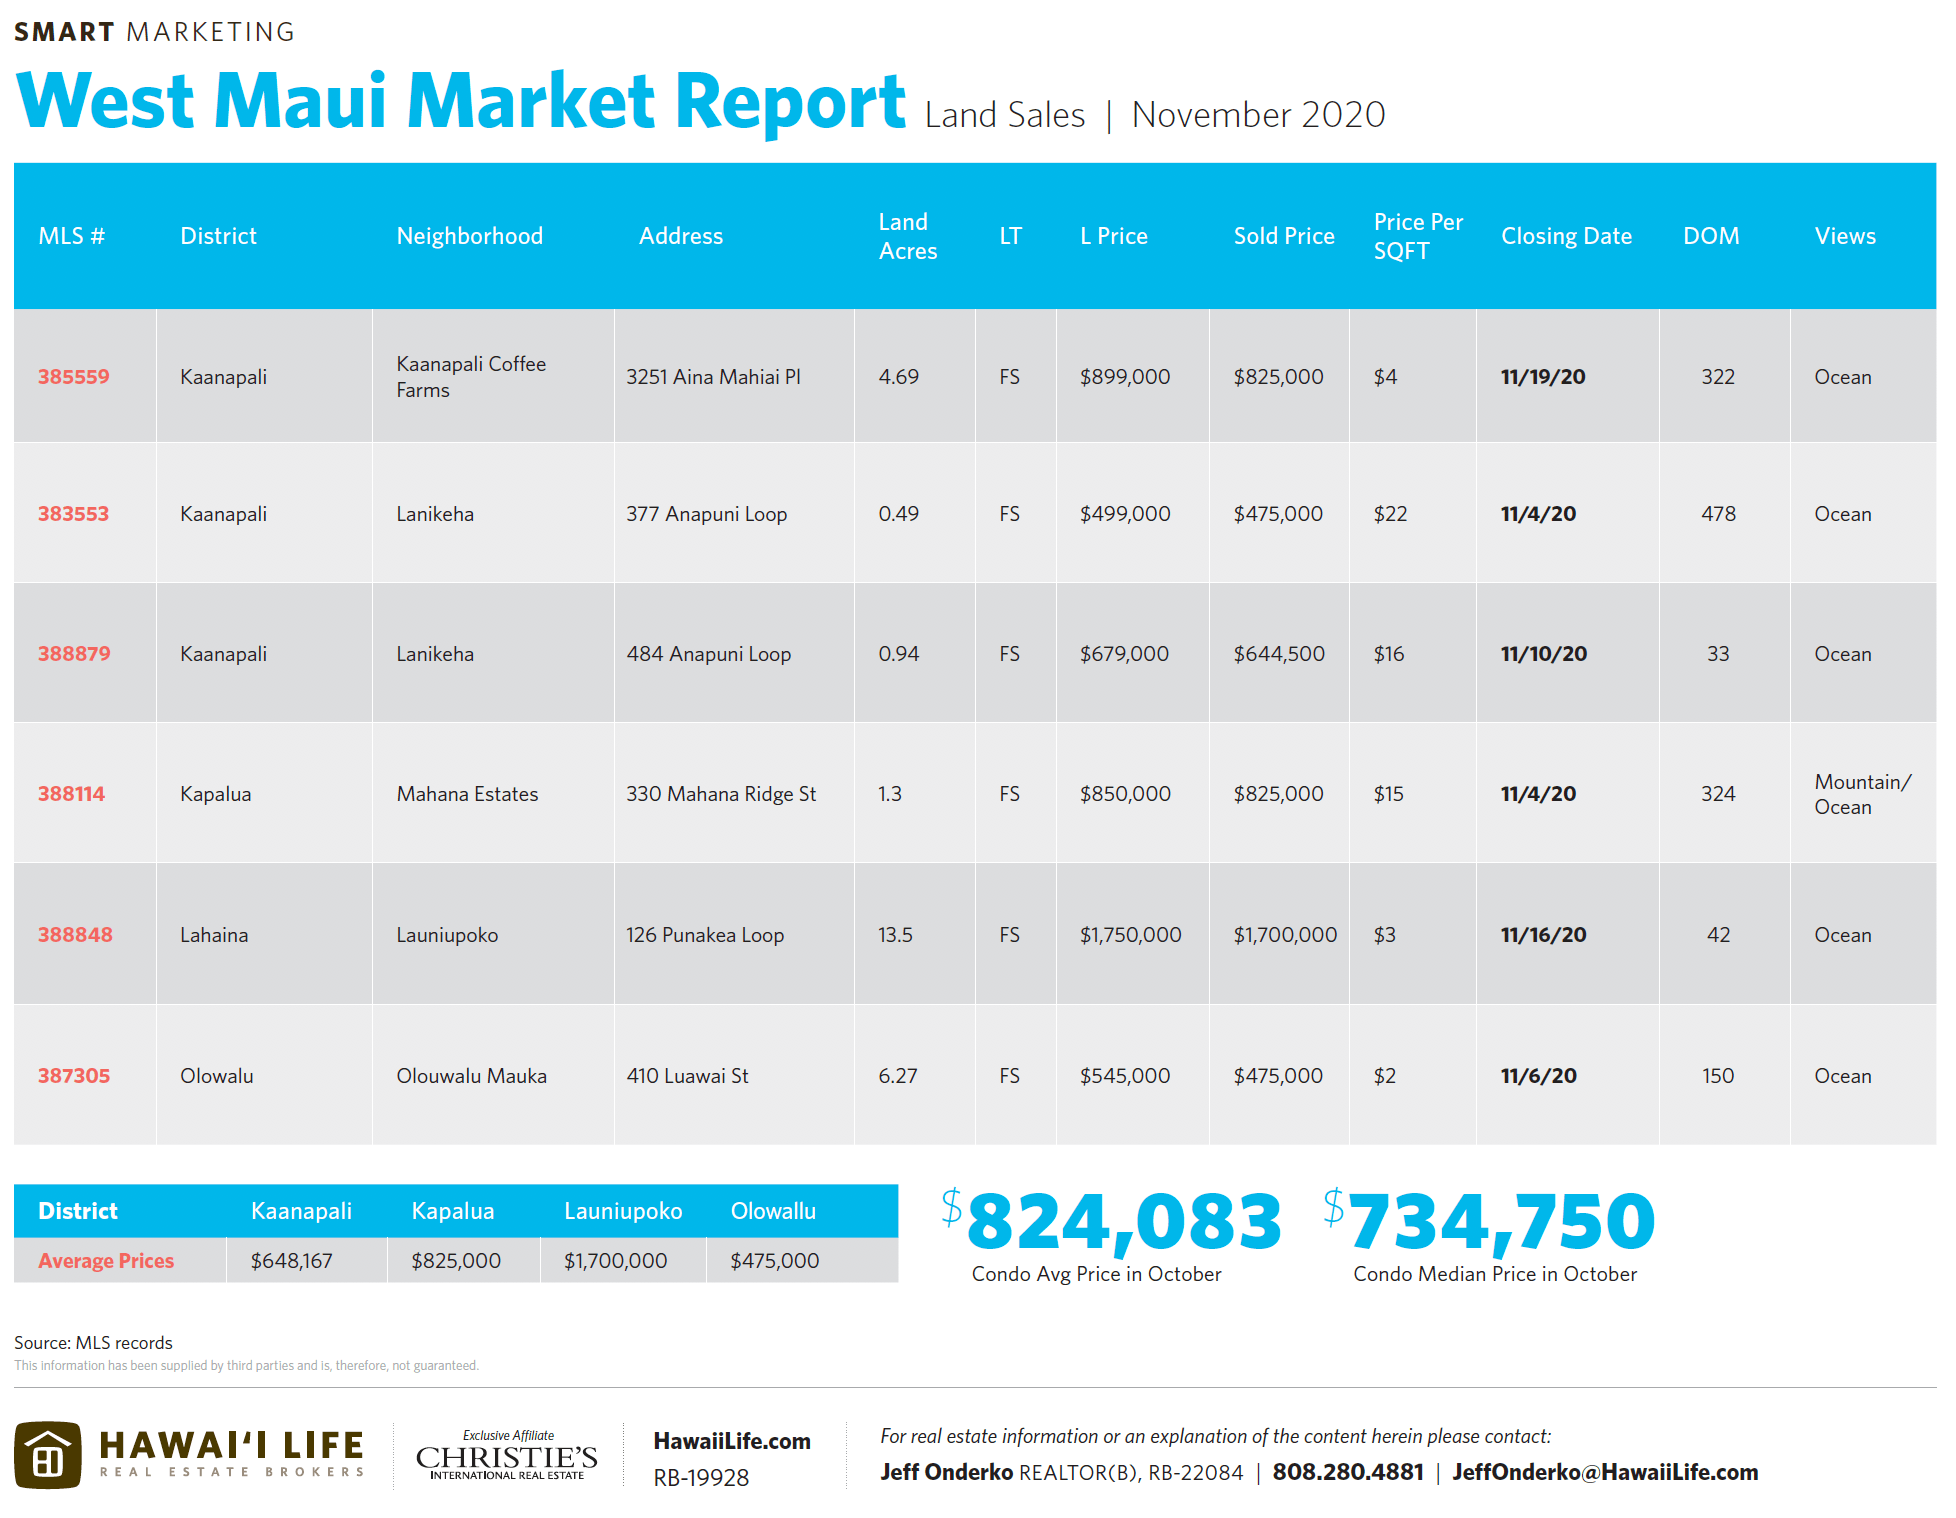
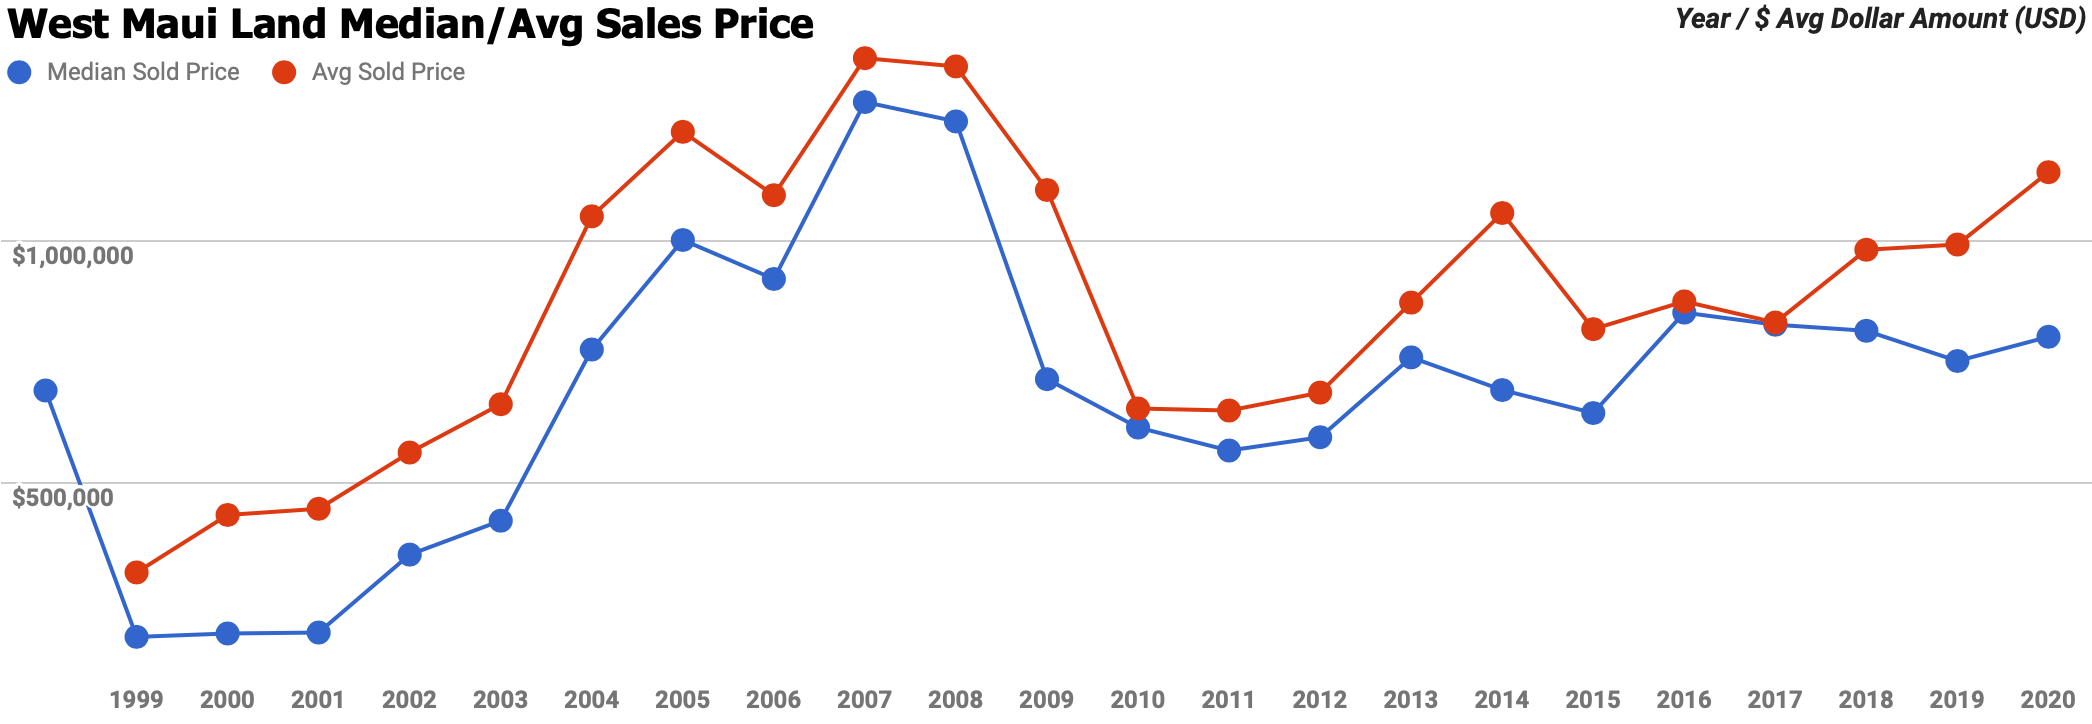
Historical Median & Average Price Comparison
| Year | Median Sold Price | Median Price % Yr Gr | Avg Sold Price | Avg Price % Yr Gr | DOM | # Sold |
| 2020 | $1,175,000 | -5.0% | $1,866,078 | 8% | 153 | 139 |
| 2019 | $1,236,922 | 2.4% | $1,727,294 | -3.2% | 173 | 137 |
| 2018 | $1,207,500 | 9.8% | $1,785,099 | 15.4% | 188 | 130 |
| 2017 | $1,100,000 | 4.8% | $1,546,633 | -3.0% | 185 | 139 |
| 2016 | $1,050,077 | 5.0% | $1,595,145 | 14.0% | 194 | 147 |
| Year | Median Sold Price | Median Price % Yr Gr | Avg Sold Price | Avg Price % Yr Gr | DOM | # Sold |
| 2020 | $635,500 | 9.7% | $911,769 | 8.3% | 186 | 459 |
| 2019 | $579,500 | 1.7% | $841,913 | 1.0% | 182 | 614 |
| 2018 | $570,000 | 4.2% | $833,812 | 2.8% | 157 | 549 |
| 2017 | $547,000 | 8.0% | $811,436 | 9.0% | 164 | 482 |
| 2016 | $506,250 | -0.7% | $744,555 | -3.9% | 211 | 490 |
| Year | Median Sold Price | Median Price % Yr Gr | Avg Sold Price | Avg Price % Yr Gr | DOM | # Sold |
| 2020 | $800,000 | 6.7% | $1,140,129 | 15.1% | 204 | 20 |
| 2019 | $750,000 | -7.7% | $990,609 | 1.1% | 256 | 23 |
| 2018 | $812,375 | -1.5% | $979,829 | 18.1% | 526 | 22 |
| 2017 | $825,000 | -2.9% | $829,477 | -5.0% | 293 | 33 |
| 2016 | $850,000 | 32.3% | $873,147 | 7.0% | 294 | 49 |
Want to Know More?
If you are in the market for buying or selling West Maui real estate or have any questions about the area or the market in general, please feel free to contact us. I welcome the opportunity to give you information on my previous sales performance and marketing strategies. Or if you’re curious about what your property is worth in today’s market, it would be my pleasure to provide you with property information and a value assessment free of any sales pitch.
Related Articles
Big Trades | West Maui Residential Prices Remain Impressively Strong
Classic & Unparalleled | Kaanapali Villas Flexing Muscles Amid SEE-O-VEE-I-D
Opportunity & Lower Prices Driving Sales at Lahaina’s Aina Nalu



Leave your opinion here. Please be nice. Your Email address will be kept private, this form is secure and we never spam you.