
October 2024 Economic Forecast & Market Report
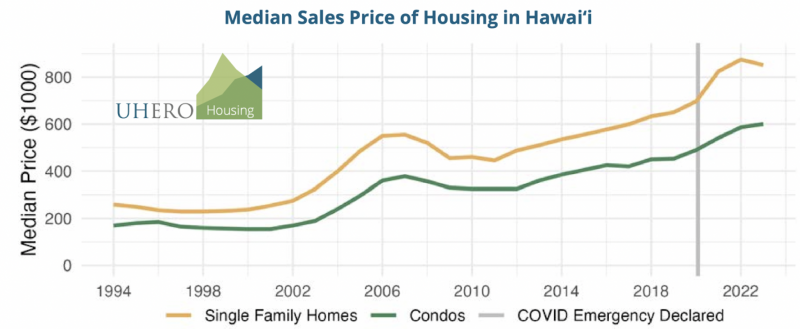
In summary, we see a few Tales of Two Markets. One market tale is about Maui lagging behind the rest of the state, during their recovery from the wildfires in August 2023. The second Tale of Two Markets is about the difference between the condo market and the single family home market. Single family homes remain relatively stable, but the condo market is filled with uncertainty around the insurance rate crisis. Interest rates are in the low 6’s, which have come down a point and half from a year ago. Hawaii continues to lead the nation with the highest housing costs. Nearly 3 times the national average. At Hawaii’s median income ($52k), only a 3rd of the population can afford the median priced homes. Supply indicators remain historically low, but continue to rise. Market velocity is around three weeks to sell a single family home and a month for condominiums.
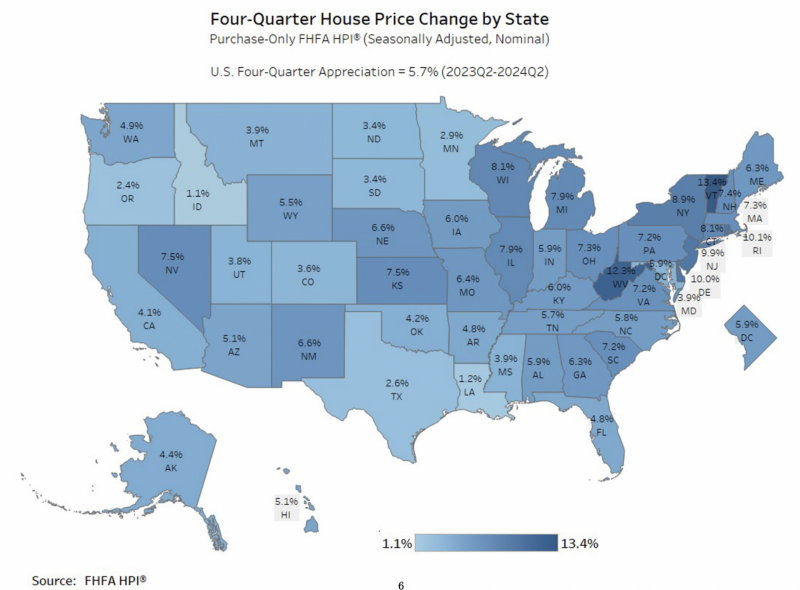
PRICE APPRECIATION
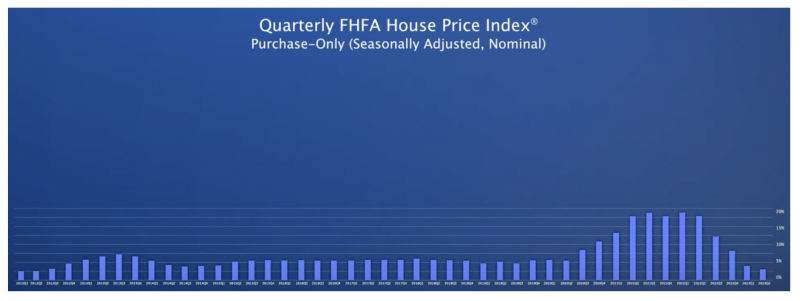
If we look at the big picture, US house prices rose 5.7% on average, in the 2nd quarter of 2024, year over year.
The 2nd quarter of 2024 was the 50th consecutive positive quarterly price gain, since 2012, for the US.
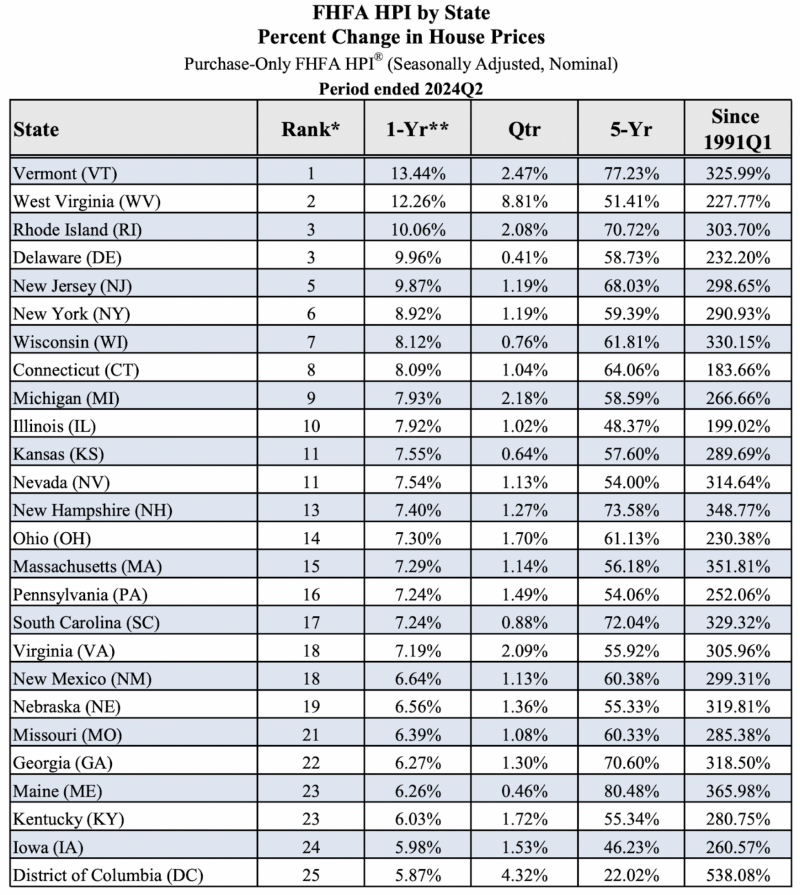
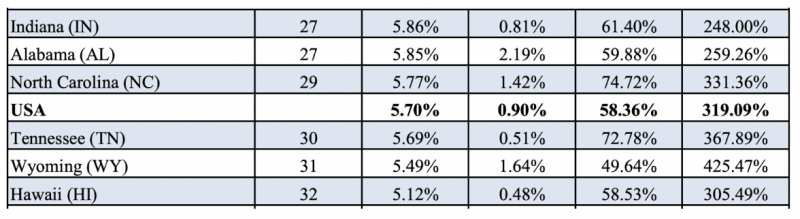
Vermont and West Virginia lead the nation with about 13% and 12% price appreciation, respectively. All 50 states and the District of Columbia had positive price appreciation. The state of Hawaii is ranked 32nd, in the country, with about an 5.1% gain, YOY.
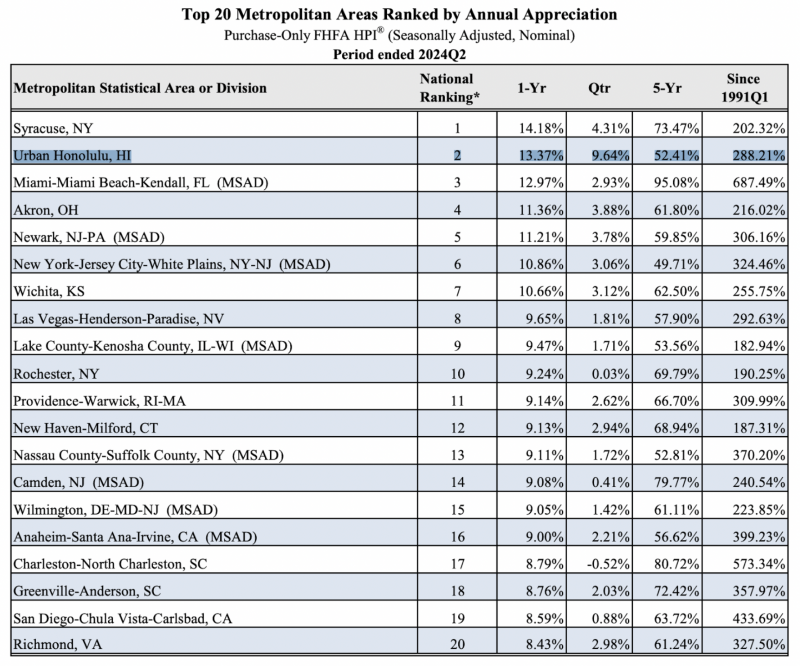
PRICE CHANGE BY CITY
The #1 ranked city, for price appreciation, is Syracuse, NY with about 14.2%, YOY. The 2nd highest was Honolulu, HI with about 13.4%, YOY (FHFA.gov).
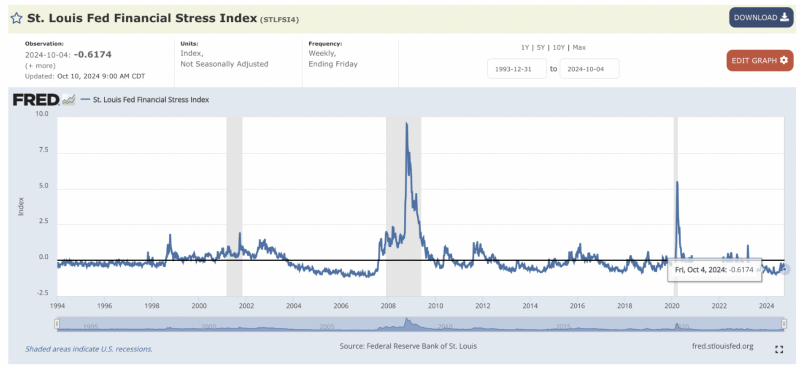
FINANCIAL STRESS INDEX
The nation’s Financial Stress Index, as of October 4th, 2024, was -.62 points. The Financial Stress Index is significantly lower compared to our last three recessions highlighted in gray. Where the index was at 5.48 points in 2020, and nearly 9 points during the financial meltdown of 2008.
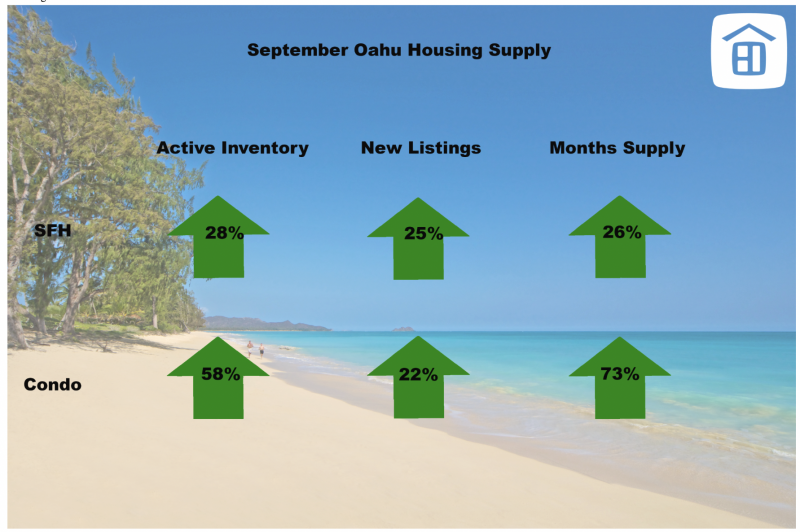
MONTHS SUPPLY
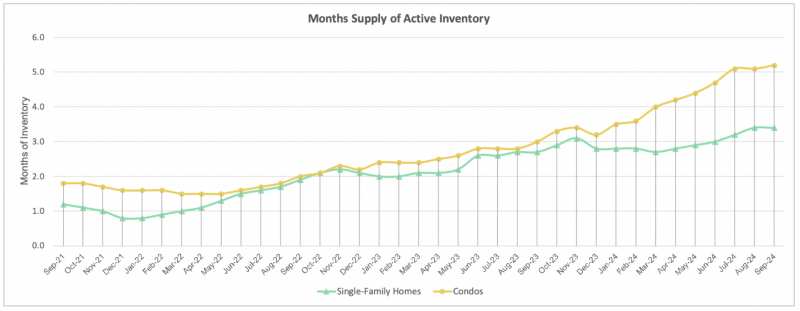
The supply indicators in September of 2024, continue to be indicative of a market in flux and change. Months supply has been steadily rising. In the Spring of 2022, months supply for Single Family Homes was at its lowest point of 1.5 months. Now in September 2024, months supply has doubled in single family homes to 3.4 months. For condos, their lowest supply numbers were in the Winter of 2021, where condos dipped below 1 months supply and their months supply numbers are up 500%, to 5.2 months. It is also important to note, that although months supply has been increasing, it is still low considering 6 months of supply is a balanced market; Neither in favor of the buyer or seller. Condos at 5.2 months of supply, is knocking on the door of a balanced market.
In the chart below, we can see supply creeping up slowly for Single Family Homes, but it is still very low. Condominiums are rising at a quicker pace. Months supply below 6 months, is considered a “seller’s market.”
Source: HicentralMLS
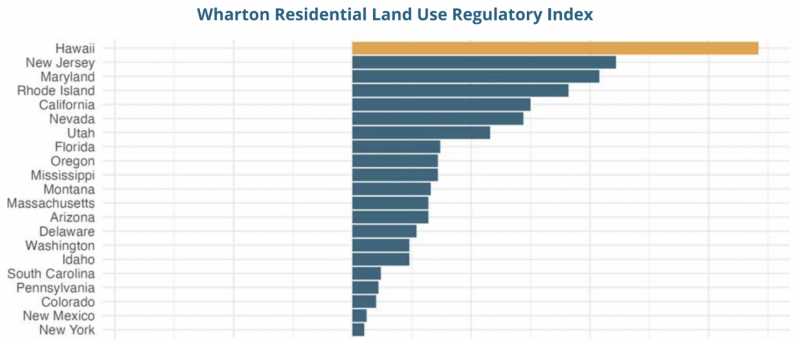
There are 557,000 housing units in the state of Hawaii. In the past 5 years, housing stocks have increased 27,000 units and 12,000 permits were issued for single-family homes. Hawaii leads the nation in the most restrictive land use regulations in the nation. On average, a permit in Hawaii will take 1 year to process.
Source: UHERO
SALES VOLUME
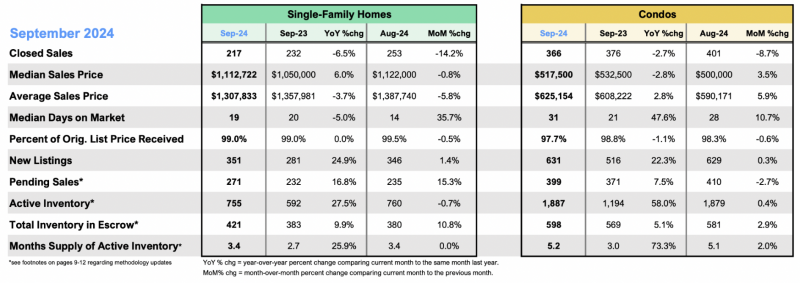
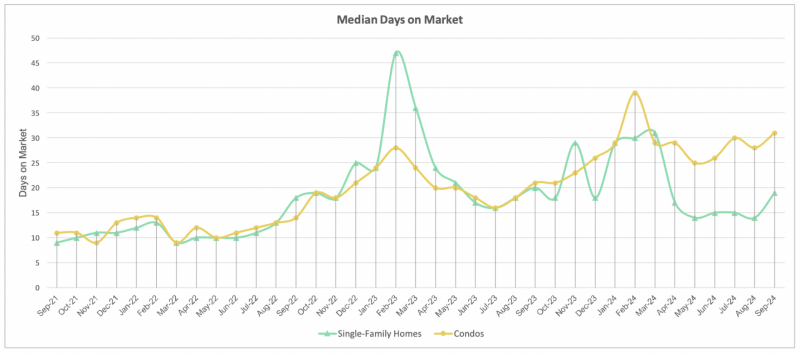
Median sales price is up 6 percent, for single family and down about 3% for condominiums, in September of 2024. Sales volume dropped 7% for single family and down 3% for condos. In September, days on market came down around 5% to almost three weeks to sell single family and up 48% to 31 days to sell condos. These figures illustrate “The Tale of 2 Markets.” Where single family prices are increasing and selling more quickly, where as condo prices are decreasing and selling much slower.
“ Tale of Two Markets” – Insurance
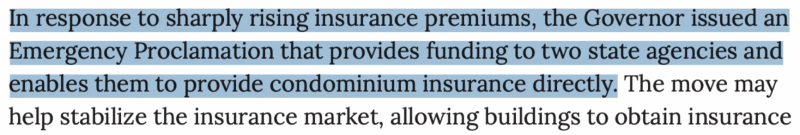
This text comes from UHERO’s September Economic Forecast and speaks to the current insurance crisis in the Hawaii condo market.
The single family market remains strong, mainly because of the lack of supply. Most home owners bought or refinanced when interest rates were the lowest they have been in generations. Therefore, most homeowners would rather stay and enjoy the low mortgage payment, rather than sell and buy again at more than double their current interest rate.
A main cause for softness in the condo market is the uncertainty surrounding insurance rates. This summer, I heard from a Touchstone manager, that there were over 400 condos in Hawaii that had insufficient insurance coverage. Meaning, if the condo was destroyed by a hurricane, they would not have the insurance funds necessary to rebuild. When condos do not have insurance coverage, local banks will not lend on them. Forcing buyers into more expensive (non-QM) loan alternatives. Recently, I messaged with Sue Savio (President, Insurance Associates) and she said, “the number of insufficiently insured condos has come down to ~200, but that it would take most of next year to get all the condos covered again.”
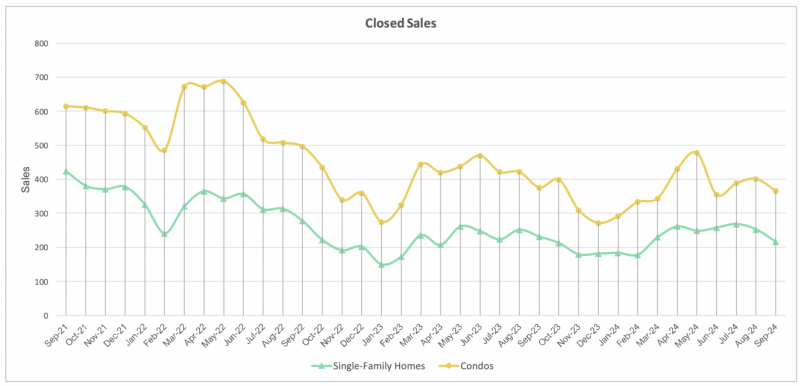
We can see the downward trend in closing volume at the end of 2024.
Comparison of home values across the nation
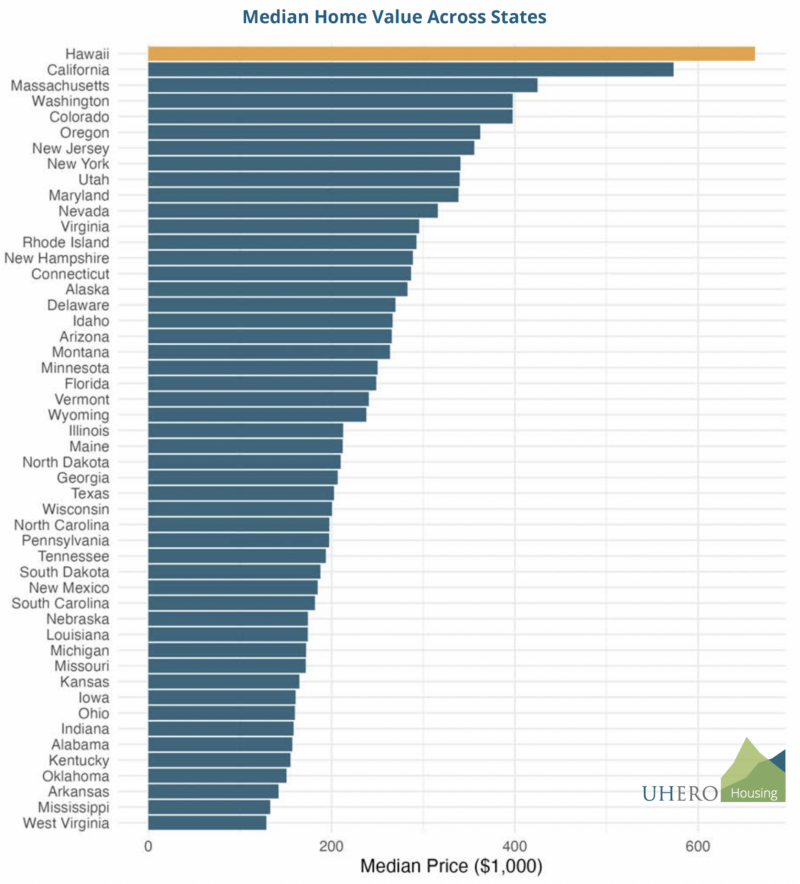
Since the mid-90’s, housing prices have tripled in Hawaii. Don’t wait to buy real estate, buy real estate and wait.
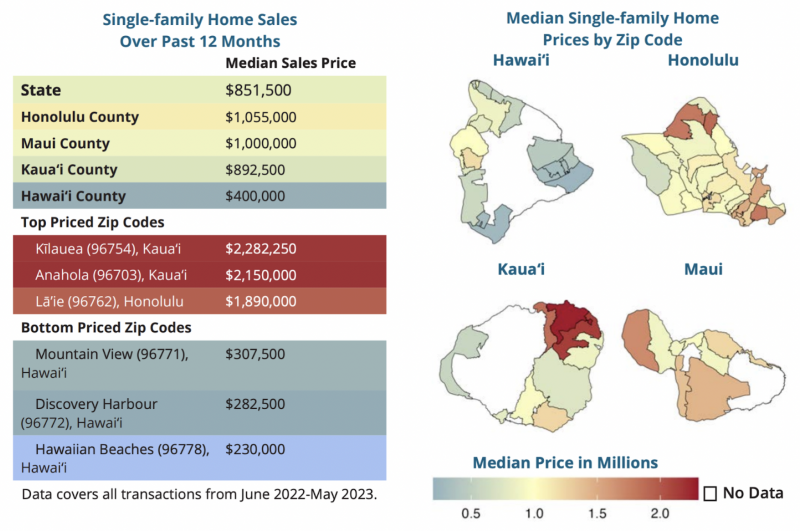
Home prices vary widely across the state. From Hawaiian Beaches at $230K, on the East end of the state, clear to Kaua’i on the West end of the major islands, at $2.3M in Kīlauea
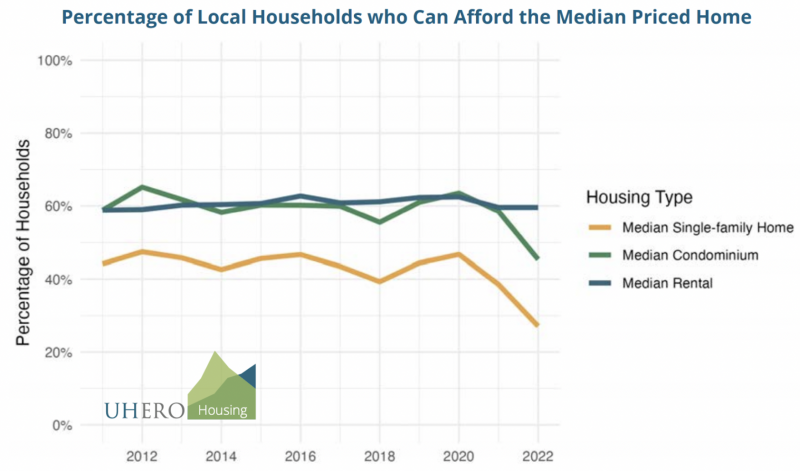
Affordability: Only 33% of local households can afford a mortgage on a median priced single family home.
Source: UHERO
WHO IS BUYING HAWAII REAL ESTATE?
For the entire state of Hawaii, around 8,400, or $7.7B, of real estate transactions occurred in the first half of 2024. Fully 72% of buyer sales volume were Hawaii Residents and 2% were foreign buyers. The next largest group of buyers were from California, at ~12%, sales volume. Japan was the top foreign buyer, totaling about $112M over 90 sales (Title Guaranty Hawaii)
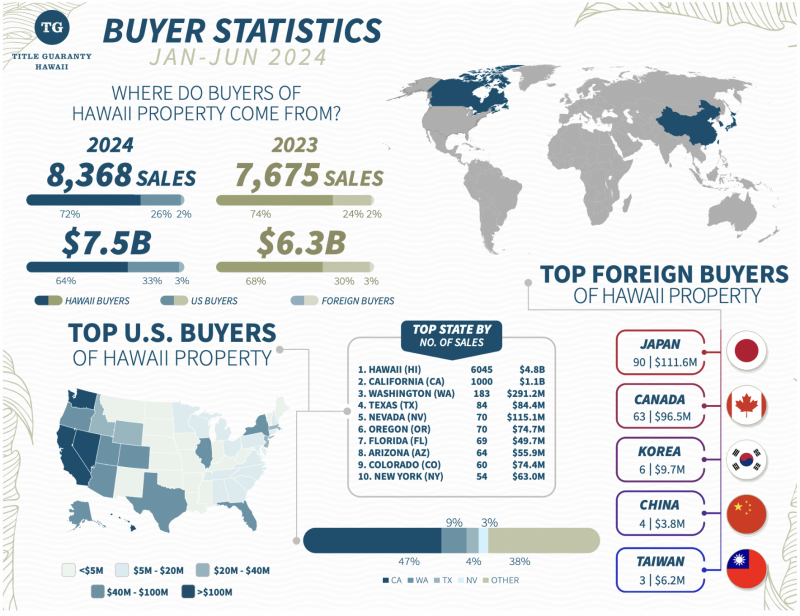
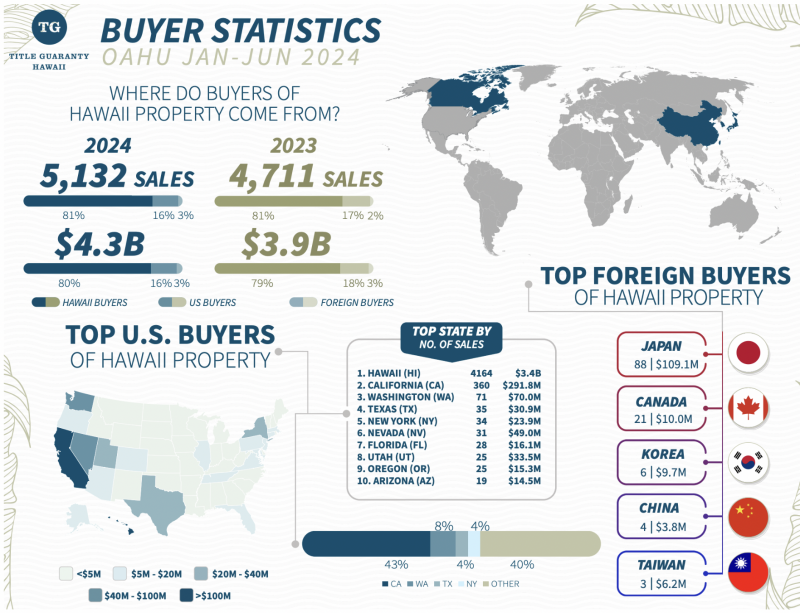
Oahu represents about 61% of the real estate sales volume & 57% of the dollar volume in the state. On Oahu, fully 81% of the transactions were Hawaii resident buyers. The next largest total of purchases came from California, at ~7% . Japan is by far the number one foreign investor on Oahu. All but 2 of the 90 total Japanese purchases in Hawaii were on Oahu.
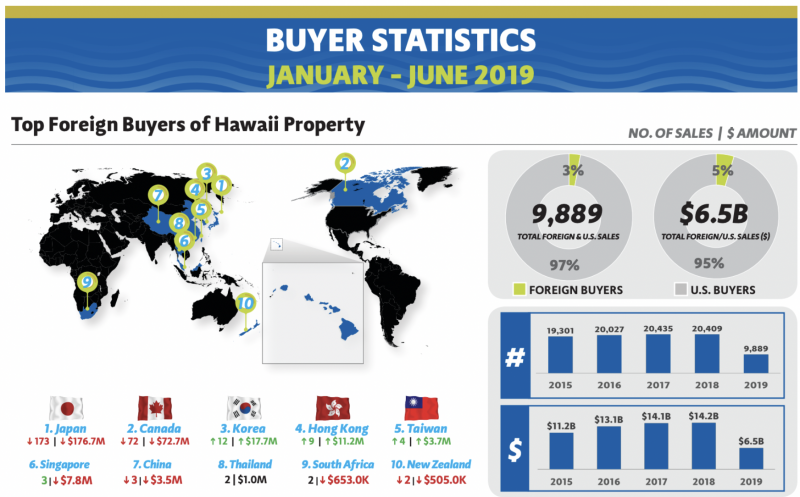
These international numbers are barely half of what they were in 2019, when foreign investment represented 5% of our state’s sales dollar volume.
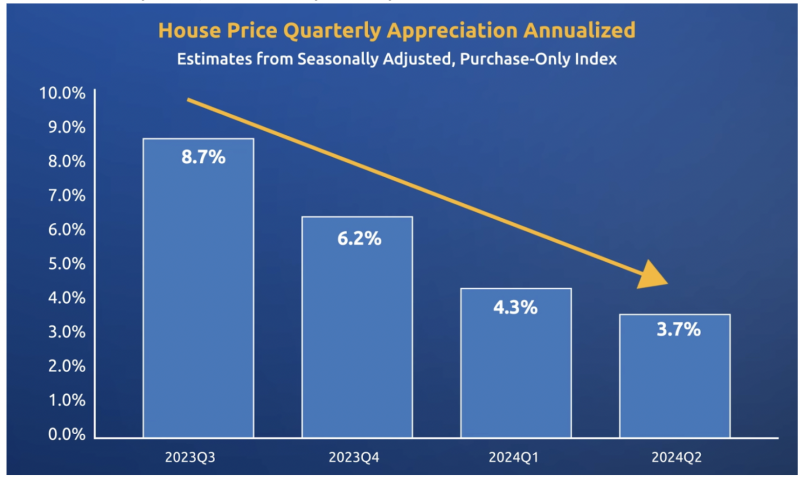
PRICE GROWTH
Although prices continue to increase, we can see that the rate of growth in the past four quarters have been on the decline. Prices have continued to grow in 2024Q2, but we can see the rate of growth decelerating.
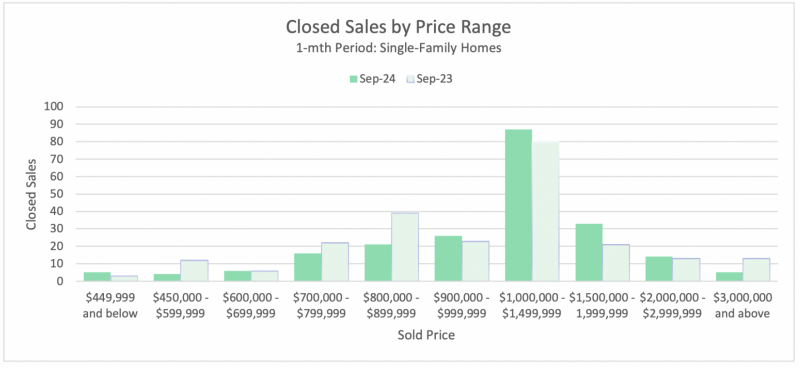
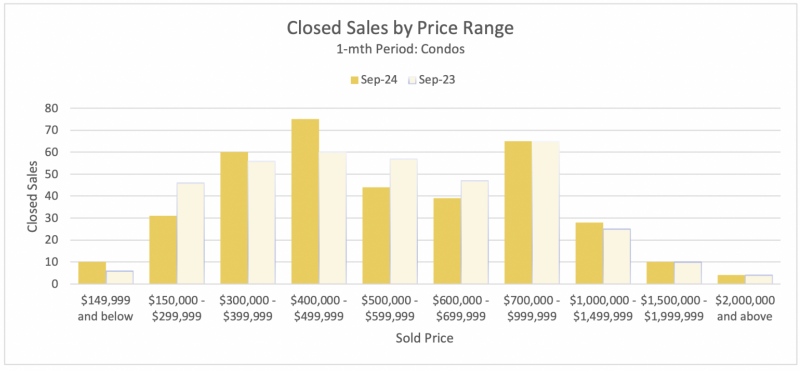
PRICE POINTS
For single family homes, we see a sweet spot from $1-1.5M, where the largest amount of closings are occurring.
For condominiums (yellow chart), we can see a nice distribution of closings over the $300-599k price range.
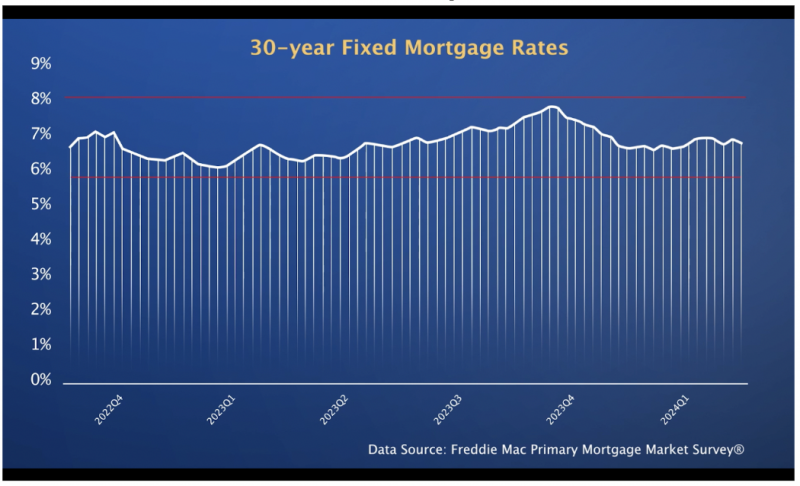
INTEREST RATES
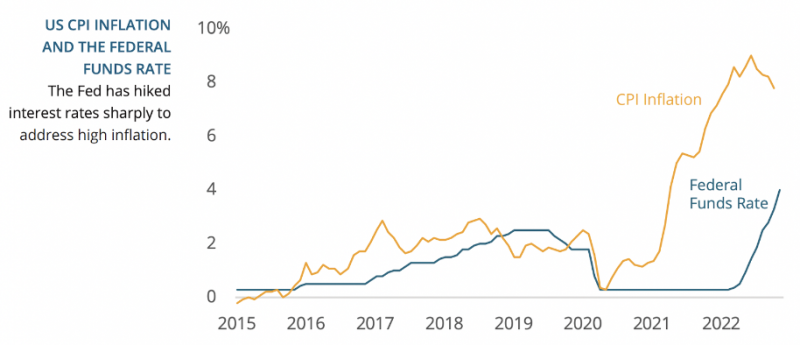
Interest rates hit a 50 year low in January 2021, at 2.65%. A year and a half ago, interest rates were within a ¼ point of tripling from their lows, at almost 8% (10/19/23). On October 10, 2024, rates have backed off to 6.32%. Still a far cry from 18.5% in 1981, but a dramatic run up nonetheless.
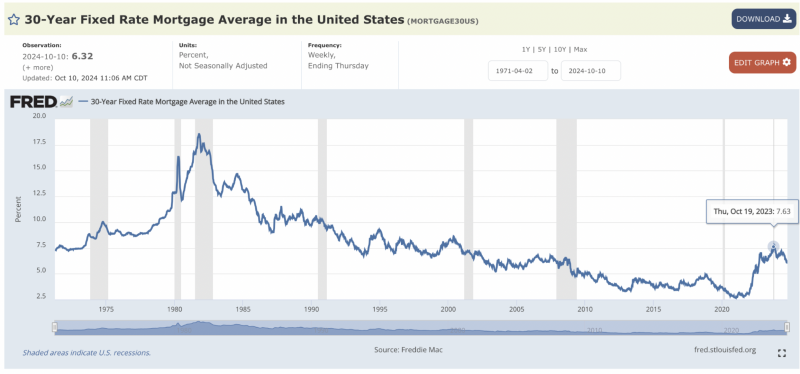
The low supply of existing homes for sale continues to put upward pressure on prices, despite interest rates that have hovered around 6-8% over the past 18 months.
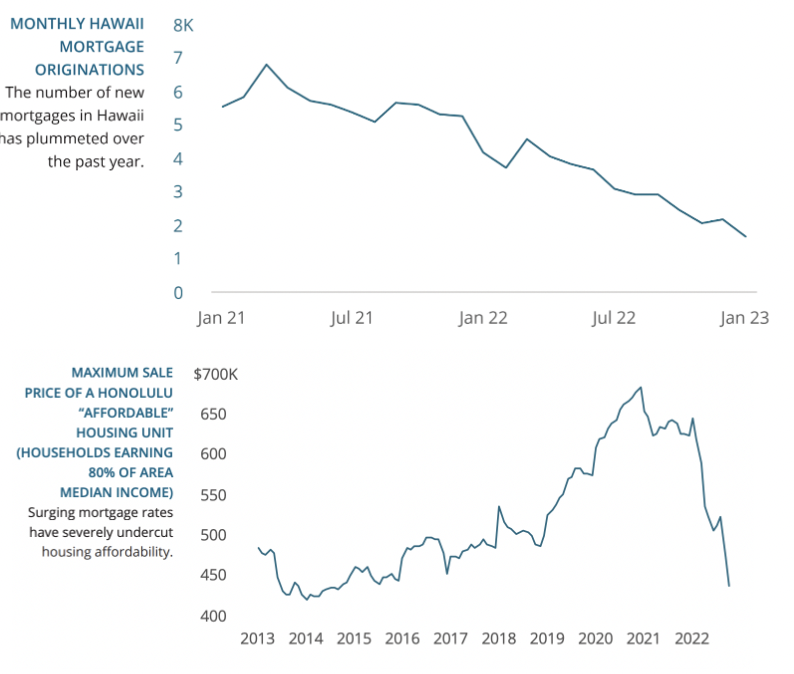
This sharp increase in interest rates, has translated into buyer’s purchasing power & loan originations to go off a cliff (Source: UHERO)
INFLATION
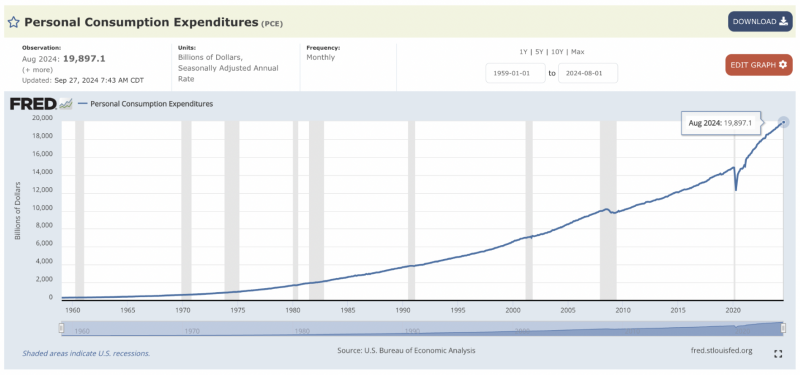
The rising cost of money is a result of the FED trying to tame inflation. In theory, increased interest rates → reduces borrowing → reduces spending → reduces demand for workers → reduces pressure on wages → reduces pressure on INFLATION. Personal Consumption Expenditures are up 33%, since the onset of Covid.
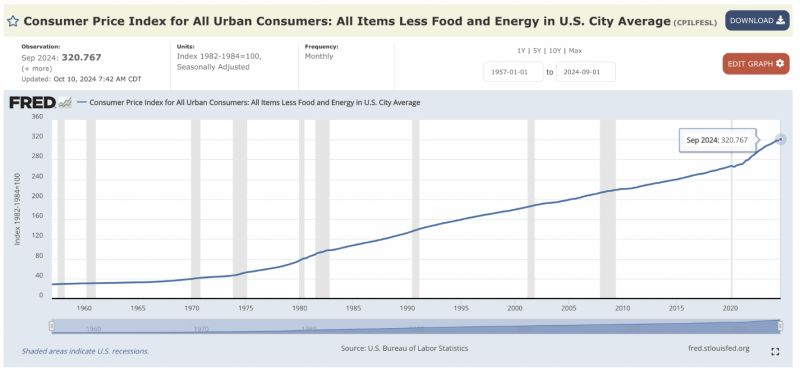
Consumer prices index is up 12% since COVID.
Owning real estate is a good hedge against inflation.
DAYS ON MARKET (Velocity)
Days on market is a good measure of “market velocity” or how quickly homes are selling. In September, market velocity for single family homes was 19 days and condominiums was 31 days. This is a 5% market velocity improvement for single family and 48% decrease for condos, YOY.
ECONOMIC ACTIVITY – “The Tail of Two Markets”
The line in the graph represents an index that tracks Hawaii’s economic activity. We can see the last 6 US recessions highlighted in gray. Since November of 2019, the index dropped 39%. In October 2022 (124 pts), we finally eclipsed our previous Pre-Covid, all time highs (123 pts). In May, we reached a new high at almost 127 pts.
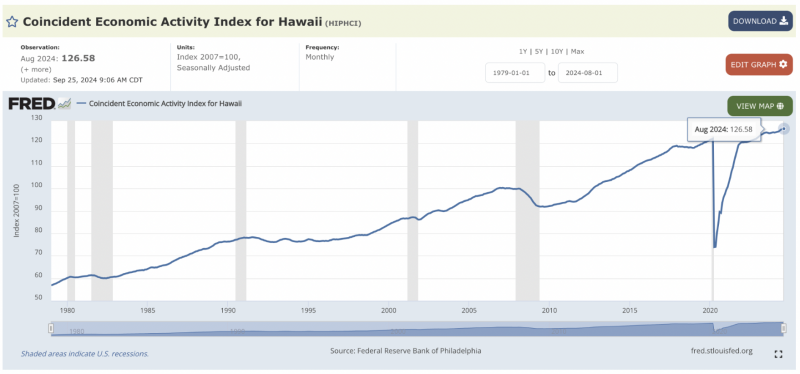
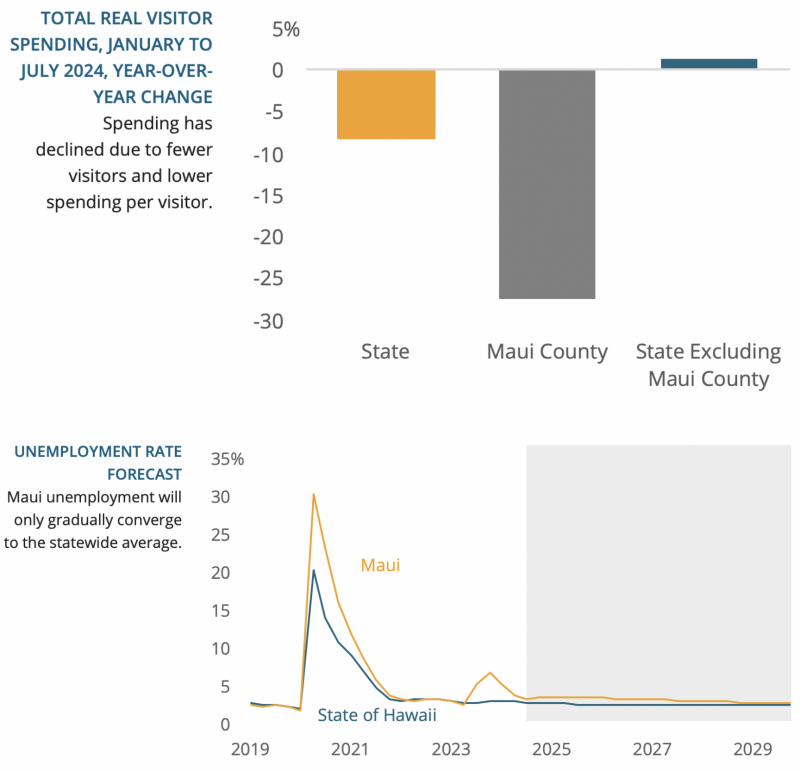
Maui’s economy will only gradually recover from the wildfire downturn, while the rest of the state’s visitor industries continue to operate at a high level with favorable macroeconomic conditions. We can see in the charts below that Maui continues it’s slow recovery from the wildfires of August 2023.
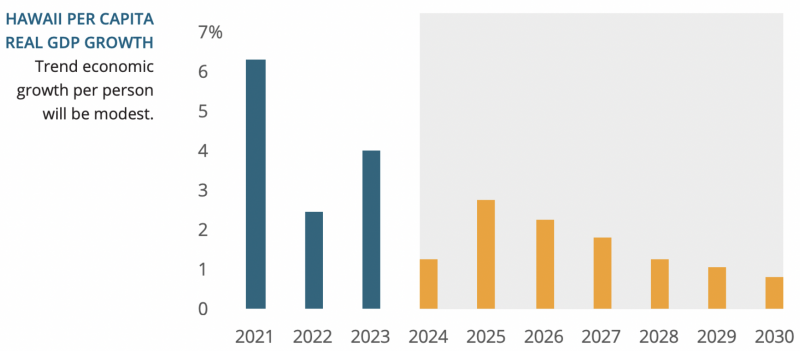
Our aging populations and continued outmigration, caused by higher costs of living, show bleak prospects for the future of Hawaii’s per capita GDP
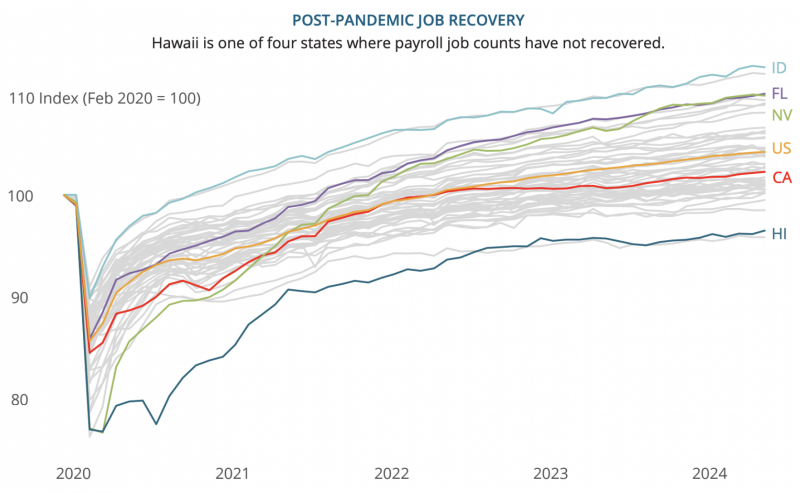
Economic Activity – Jobs
In 2024, Hawaii is still waiting for Japanese tourists to return to Hawaii. These effects are felt most on Oahu. Add to this equation the disastrous impact of the Maui fires and you can see why Hawaii is in the nation’s last place for the post-pandemic job recovery
UHERO
VISITOR Spending, Days & Arrivals
Visitor expenditures were +16.6% higher than the same period, 2019.
Visitor Days are down ~7.5% lower than pre Covid numbers.
Visitor Arrivals are ~8% lower than 2019.
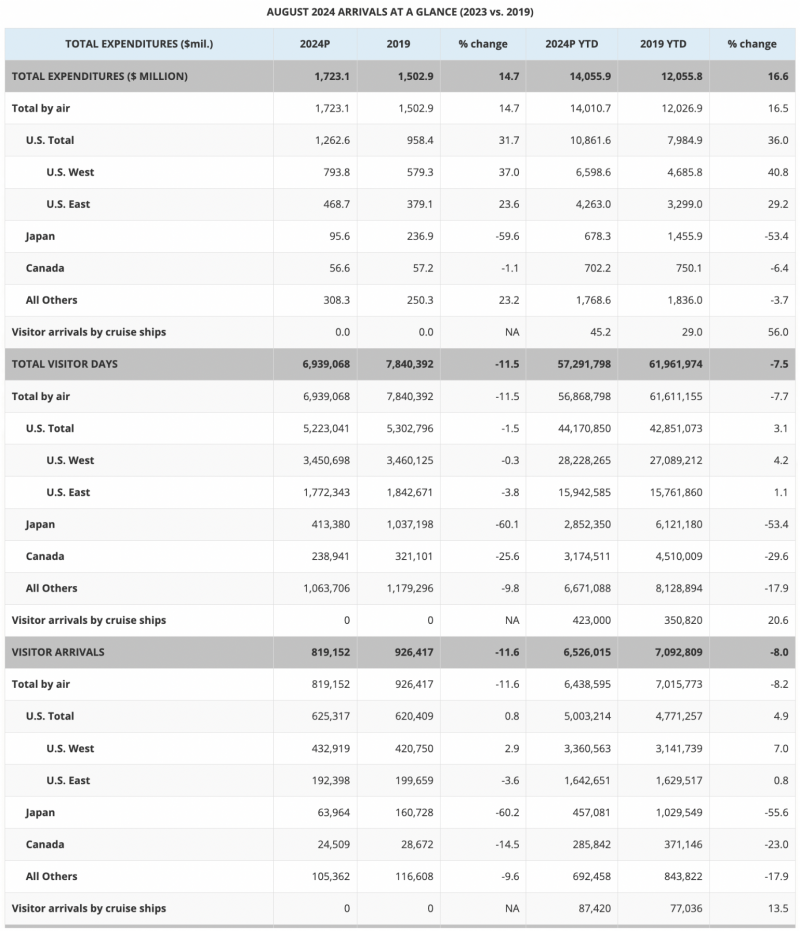
Source: DBEDT.Hawaii.gov

Leave your opinion here. Please be nice. Your Email address will be kept private, this form is secure and we never spam you.