As part of my commitment to keeping the community informed about West Maui’s micro-market real estate environment, I’m bringing you an up-to-date, comprehensive market summary of the neighborhoods Launiupoko and Puunoa — West Maui’s premier agricultural estate neighborhoods.

What You’ll Find
- Actual Sales Prices: learn exactly how much specific properties sold for
- Sales Volume: see the strength of the market in terms of how many properties sold
- Days on Market: understand how long it takes the average property to sell
- List Price vs. Sold Price: see how the final sales price compares to the listing price
- Price Per Square Foot: which is critical in calculating real estate values
- Asset % Growth: what is the year over year appreciation of my property
- Current Inventory: what is actively for sale and currently under contract
Before we dig into the numbers, make sure you subscribe to my blog if you want to be notified of future market reports as they come available.

Current Market Snapshot
It’s easy to say it’s still the #1 choice for luxury Buyers wanting the benefits of agricultural space/acreage mixed into a residential neighborhood. Since 2017 Launiupoko/Puunoa has made up 63%, 30% and this year’s 42% of West Maui’s $3M+ luxury real estate market. However, with that said since the banner year of 2017, sales volume has taken a decline by nearly 50% (see chart below). But again, 2017 was an exceptional sales year from the perspective of traded properties and what we see now is (17-22 total sales) more of the normal market cycle.
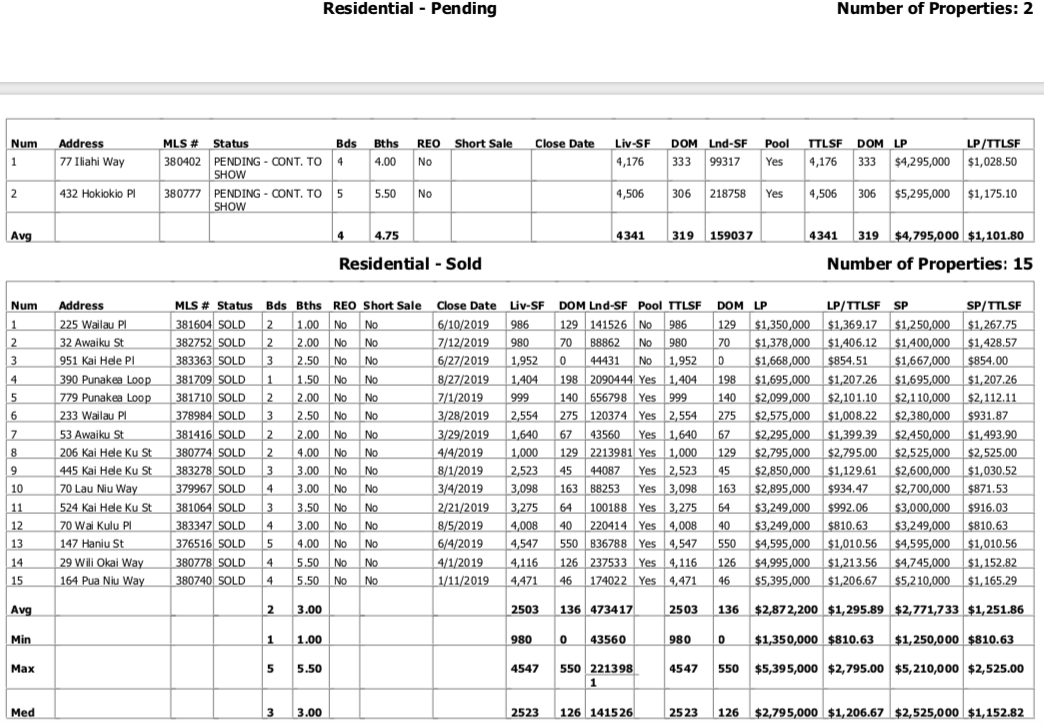
While last year was a bit gaudy with Launiupoko having 2 very large sales at $11M & $7M respectively. 2019 sales prices still remain strong.
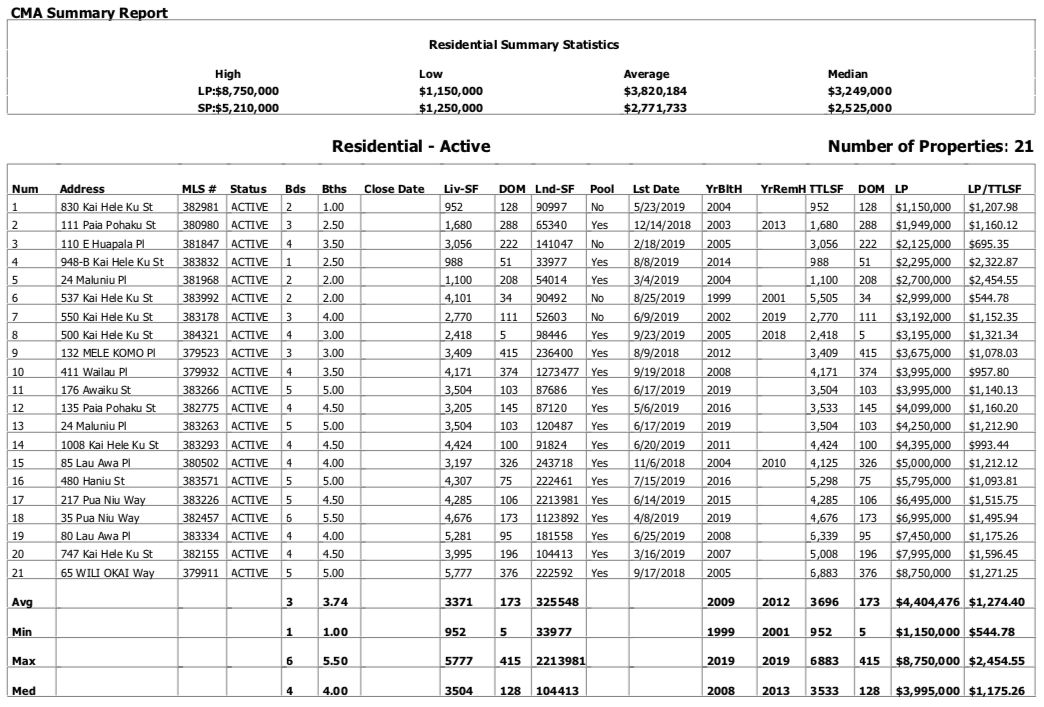
There are currently 21 homes actively listed for sale ($1.15M – $8,75M) and 12 land parcels for sale listed ($695K – $3M).
Launiupoko Main House Sales Summary
Launiupoko/Makila/Puunoa | |||||||
Main House Avg Sale Price | |||||||
| Year | Avg List Price | Avg Sold Price | % List Sell | % Yr Gr | $/Sq Ft | DOM | # Sold |
| 2019 | $3,496,778 | $3,349,556 | 96% | -28% | $971 | 145 | 9 |
| 2018 | $4,867,300 | $4,645,600 | 95% | 55% | $1,043 | 229 | 10 |
| 2017 | $3,156,300 | $3,005,138 | 95% | -10% | $891 | 193 | 20 |
| 2016 | $3,613,000 | $3,352,000 | 93% | 41% | $973 | 192 | 10 |
| 2015 | $2,537,400 | $2,370,600 | 93% | -15% | $978 | 299 | 5 |
| 2014 | $3,053,300 | $2,792,650 | 91% | 26% | $872 | 206 | 10 |
Launiupoko Cottage Sales Summary
Launiupoko/Makila/Puunoa | |||||||
| Cottage Avg Sold Price | |||||||
| Year | Avg List Price | Avg Sold Price | Sold/List | Yr Gr | $/Sq Ft | DOM | # Sold |
| 2019 | $1,935,333 | $1,905,000 | 98% | 26.7% | $1,672 | 122 | 5 |
| 2018 | $1,608,600 | $1,503,000 | 93% | -3.4% | $1,589 | 199 | 5 |
| 2017 | $1,637,909 | $1,555,159 | 95% | 14.2% | $1,572 | 214 | 11 |
| 2016 | $1,451,900 | $1,362,273 | 94% | -10.8% | $1,334 | 246 | 11 |
| 2015 | $1,689,143 | $1,527,286 | 90% | 14.6% | $1,527 | 202 | 6 |
| 2014 | $1,384,111 | $1,333,056 | 96% | 37.8% | $1,341 | 216 | 9 |
Launiupoko Main House Sales Summary – By Acre
Launiupoko & Puunoa neighborhoods range from .5 acres to 15+ acre estate lots. The reason why I breakdown sale per acre is to get a more precise apples to apples approach when comparing property sales and value.
Launiupoko/Makila/Puunoa | |||||
Main House Avg Sale Price | |||||
| Year | < 2 Acres | 2-5 Acres | > 5 Acres | > 15 Acres | # Sold |
| 2019 | $2,133,500 | $3,322,500 | $3,997,000 | $4,595,000 | 9 |
| 2018 | NA | $3,371,200 | $5,700,000 | $6,066,667 | 10 |
| 2017 | $3,700,000 | $2,851,583 | $3,907,500 | 20 | |
| 2016 | $2,750,000 | $3,262,500 | $3,630,000 | $3,200,000 | 10 |
| 2015 | $1,798,333 | $2,958,000 | $3,500,000 | 5 |
Launiupoko Cottage Sales Summary – By Acre
Launiupoko/Makila/Puunoa | |||||
| Cottage Avg Sold Price | |||||
| Year | < 2 Acres | 2-5 Acres | > 5 Acres | > 15 Acres | # Sold |
| 2019 | $2,450,000 | $1,325,000 | $2,110,000 | 5 | |
| 2018 | $1,100,000 | $1,338,333 | $2,400,000 | 5 | |
| 2017 | $1,003,750 | $1,561,667 | $2,100,000 | 11 | |
| 2016 | $1,248,000 | $1,458,250 | $1,512,000 | $1,400,000 | 11 |
| 2015 | $1,535,000 | $1,695,333 | 6 | ||
| 2014 | $1,304,688 | $1,560,000 | 9 |
Launiupoko Land Sales Summary – By Acre
Launiupoko/Makila/Puunoa | |||||
Land Avg Sold Price | |||||
| Year | < 2 Acres | 2-5 Acres | > 5 Acres | > 15 Acres | # Sold |
| 2019 | $750,000 | $1,629,800 | 6 | ||
| 2018 | $1,317,800 | $1,680,000 | 9 | ||
| 2017 | $1,006,667 | $1,750,000 | 4 | ||
| 2016 | $955,000 | $750,500 | $900,000 | $1,346,156 | 18 |
| 2015 | $573,500 | $770,000 | $941,667 | 7 | |
| 2014 | $735,800 | $808,333 | $800,000 | $1,925,000 | 11 |
2019 Sales & Active Market
Want to Know More?
If you are in the market for buying or selling Launiupoko real estate or have any questions about the area or the market in general, please feel free to contact me. I welcome the opportunity to give you information on my previous sales performance and marketing strategies. Or if you’re curious about what your property is worth in today’s market, it would be my pleasure to provide you with property information and a value assessment free of any sales pitch.


Leave your opinion here. Please be nice. Your Email address will be kept private, this form is secure and we never spam you.