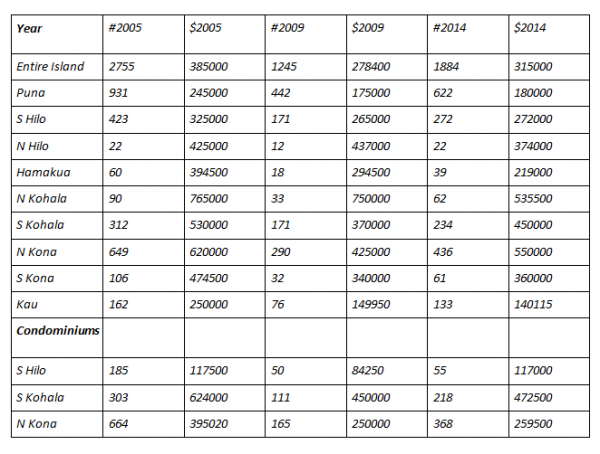
Among the most popular reads is the quarterly market update. I routinely report statistical changes in selected neighborhoods. We’ll get to that soon but because of the new island-wide format I thought it might be interesting to go back in time and compare the “good, the bad and the ugly” of Big Island sales stats.
Below is a comparison of the highest (2005), lowest (2009) and recent year end statistics. As time allows, I will share data regarding targeted Hawaii Island neighborhoods so stay tuned. There’s more time travel to come!


Leave your opinion here. Please be nice. Your Email address will be kept private, this form is secure and we never spam you.